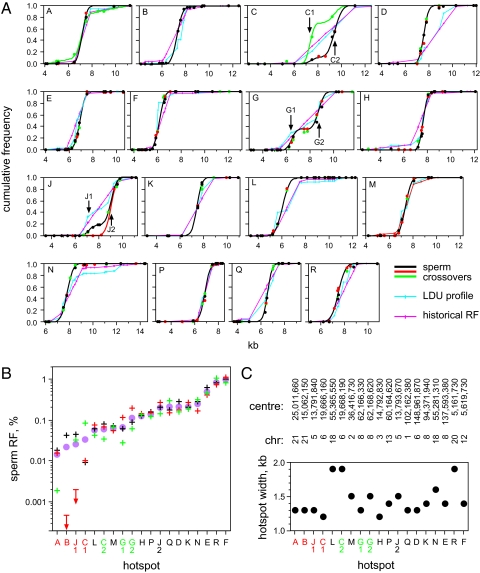
Fig. 2.
Cross-over hotspots identified by sperm typing. (A) Cumulative frequency of sperm cross-overs across each test interval (A–R) established for three informative men (black, red, green circles) per target. Each man was assayed for reciprocal cross-overs, and the results were combined. Only two men were available for typing at target B; one showed a very low cross-over frequency and is not shown. Best-fit cumulative normal distributions (6) are shown in black or in different colors for men showing unusual distributions. These distributions are compared with LDU profiles and historical recombination profiles determined from genotypes of 94 semen donors and normalized to 1 for each test interval. Double hotspots are arrowed. (B) Sperm RF per hotspot for each man, color coded as in A, plus mean RF (circle). Hotspots are ranked by mean activity. Hotspots labeled in red show major variation in activity between men; those marked in green showed weaker variation with a 2- to 4-fold difference in activity between the most and least active man. (C) Hotspot widths within which 95% of cross-overs occur, estimated from best-fit normal distributions, together with chromosomal coordinates of hotspot centers in the National Center for Biotechnology Information 36 assembly of the human genome.

