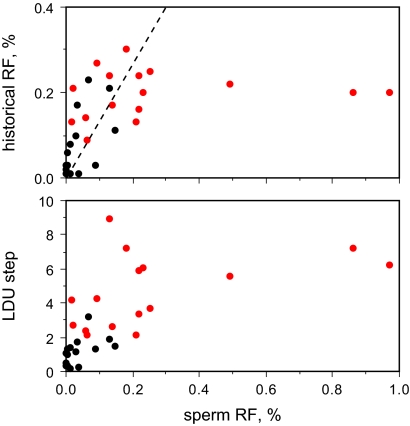
Fig. 3.
Relationship between DNA diversity and sperm cross-over activity. Historical cross-over activity and LDU step size were estimated from semen donor genotype data for each of the 16 strong LD hotspot regions (in red), with double hotspots combined, and for 15 previously characterized sperm hotspots genotyped in the same panel of semen donors (in black) (5–13). The dotted line shows the expected relationship between sperm and historical activity, corrected for the greater mean cross-over frequency seen in female meiosis (27).

