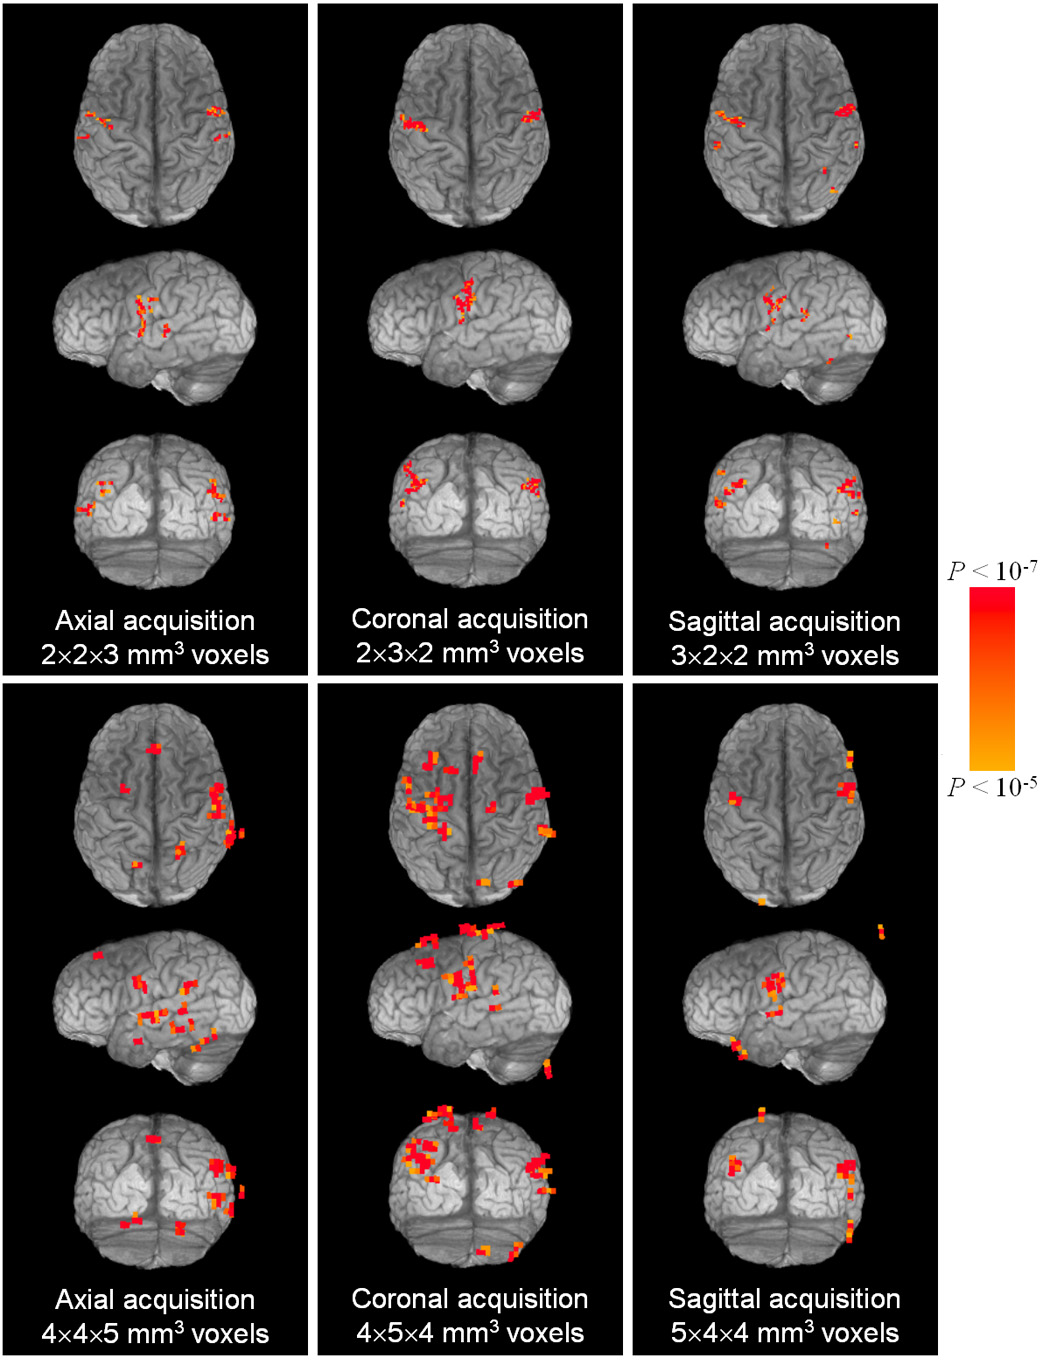
Fig. 4.

For a single subject, 3D rendered images of the brain are shown transparent to activation (VTOT) remaining after statistical and motion-suppression thresholds (α = 0.01). (Voxel dimensions are given in terms of R-L, A-P, and S-I axes, respectively. On axial and coronal views, right is on the right.)
