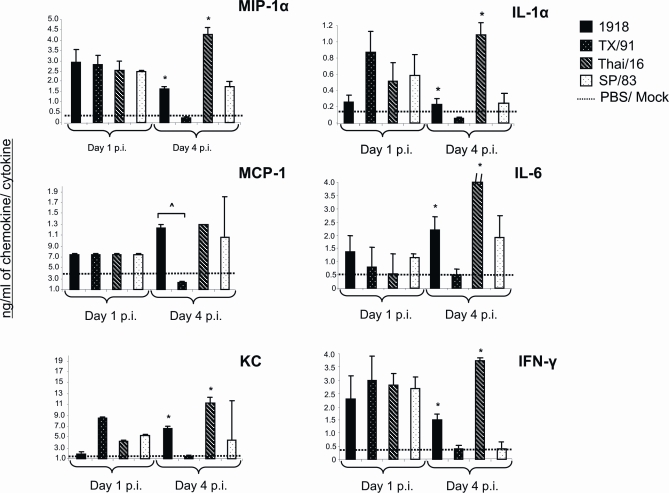
Figure 3. Lung cytokine response.
Cytokine levels from infected lungs (n = 3 mice per virus group, days 1 and 4 post-inoculation (p.i.)) were measured individually and in duplicate by the Bioplex Protein Array system lungs. Baseline cytokine levels from PBS inoculated mice (mock) are shown as a dashed line in each cytokine graph. Bars represent means of 3 mice from each infection group±standard deviation (SD). Protein levels of IL-6 in Thai/16 infected animals exceeded the y scale shown (indicated by a dash//, the concentration in Thai/16 infected mice was 11.7 ng/ml). ˆ p<0.05 between 1918 and TX/91 viruses, * p<0.05 between 1918 and Thai/16 (HP) virus groups and SP/83 and TX/91 (LP).

