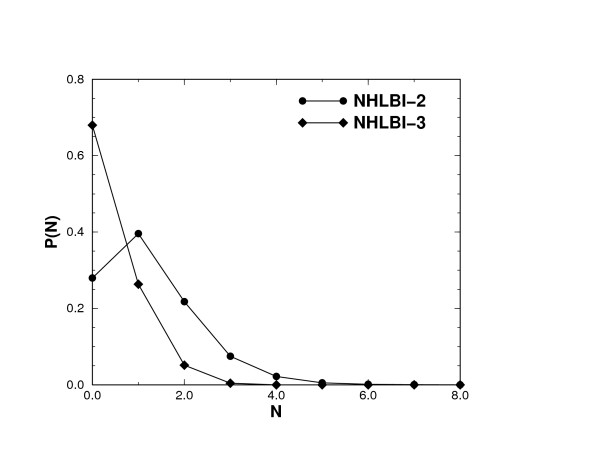
Figure 2.
Histograms of mass fragments overlap. P(N) is the normalized histogram of the number of overlapping fragments of the b and y types between 2 or among 3 peptides from the 110 unique peptides in the co-identifiable set. The peak at N = 1 for two peptides is due to that fact that the C-terminal amino acid is either K or R, resulting in a large probability for two peptides to have the same y-1 peaks and thus contribute significantly to the histogram at N = 1. This artifact diminishes as we look into the shared peaks among three peptides since the chance for peptides to share the same C-terminal amino acid decreases with the number of peptides.

