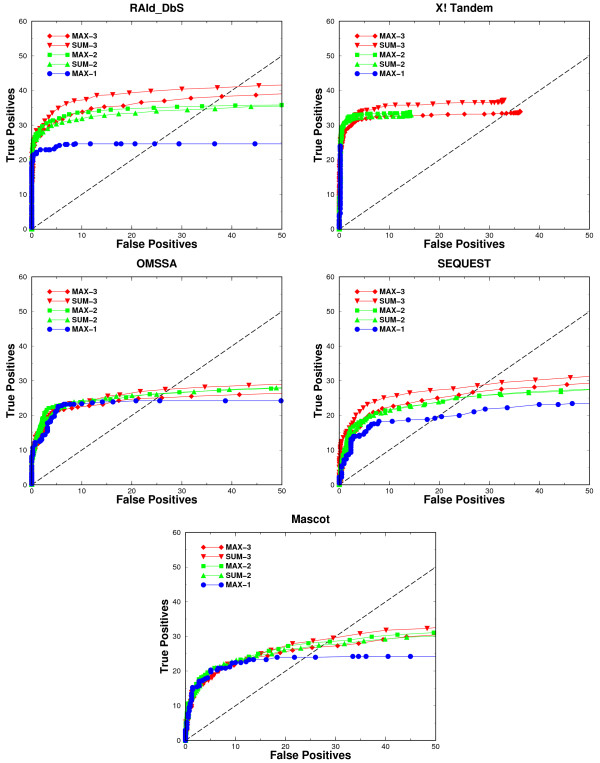
Figure 6.
ROC analyses of compound spectra of distinct peptides. ROC curves constructed from analyzing the compound spectra formed by combining a number of unique peptide spectra of the LTQ/LTQ type. In the figure legend, MAX-1 represents the ROC curve from analyzing single peptide spectra sampled directly from the co-identifiable set, MAX-2 (SUM-2) and MAX-3 (SUM-3) are the ROC curves from analyzing compound spectra formed by combining respectively two and three single-peptide spectra in the co-identifiable set. The symbol "MAX" in the legend indicates that each compound spectrum is obtained by taking at every mass grid the maximum intensity among the peaks of the spectra combined, while "SUM" in the legend indicates the compound spectra are obtained through summing at every mass grid the intensities of peaks of the spectra to be combined. The Arabic numbers 2 and 3 in the legend indicate the number of spectra combined to form a compound spectrum.

