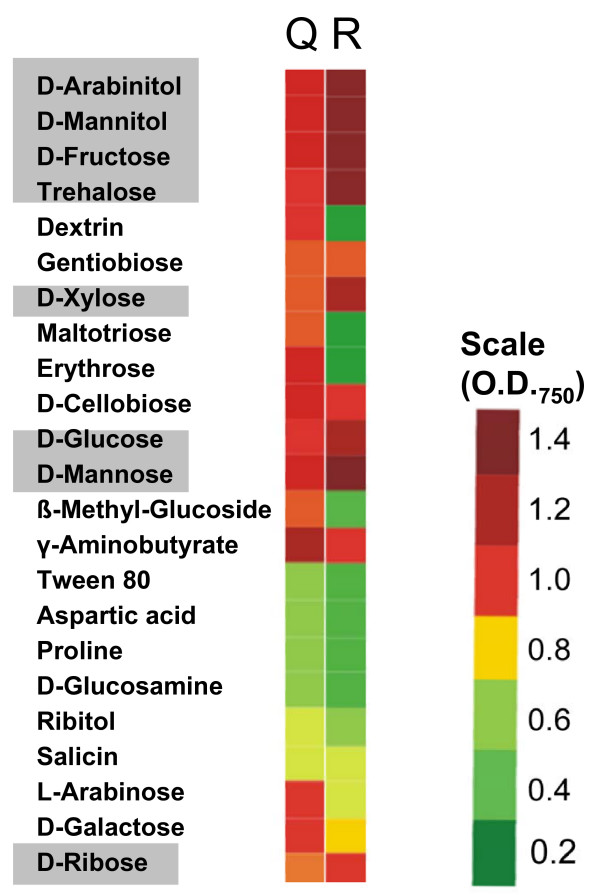
Figure 6.
Phenotype array analysis of carbon source profiles of H. jecorina QM6a (Q)and RUT C30 (R). Only carbon sources where a difference to the parent strain QM6a was found are shown, and given in a color code. The OD750 refers to measurements at 48 hrs of growth, at which time the value is proportional to the growth rate (OD750/h) of the fungus on the respective carbon source. Carbon sources which are highlighted by a grey background are those which result in higher growth rates in RUT C30.

