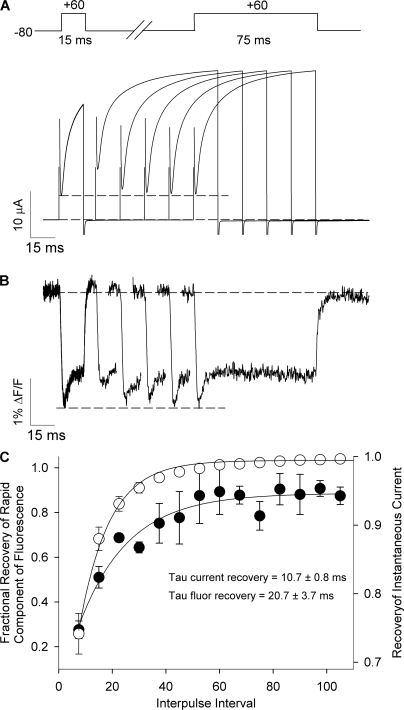
Figure 8.
Time course for the recovery of the de-quenching component of fluorescence. (A and B) Ionic current and fluorescence signals recorded during the voltage protocol shown. The time course of the recovery of the dequenching component fluorescence amplitude was assessed during 75-ms test pulses to +60 mV applied at different intervals following a 15-ms conditioning pulse to +60 mV. The fluorescence signal, but not ionic current during the test pulse has been truncated for purposes of clarity. The dashed lines mark the conditioning pulse instantaneous ion current (in A) or fluorescence amplitude (in B) for comparison. (C) Fractional recovery of the dequenching component of fluorescence amplitude (filled symbols) or the recovery of instantaneous current (open symbols) recorded from three different oocytes during test pulses applied at different intervals following 15-ms conditioning pulses. Data are shown as mean ± SEM. When fitted with a single exponential function, the instantaneous current recovery had a time constant of 10.7 ± 0.8 ms and that of fluorescence was significantly slower 20.7 ± 3.7 ms (P < 0.05, n = 3).

