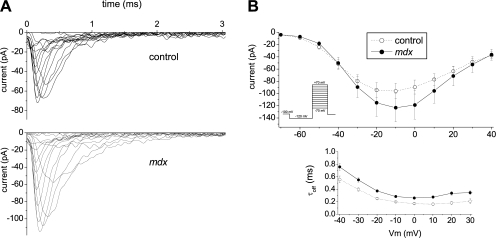
Figure 3.
Electrophysiological measurements of Nav1.4 activity in cell-attached patches. (A) Representative traces of cell-attached Na+ currents in C57BL/6J (top) and mdx5cv (bottom) FDB fibers. Of note are the longer inactivation tails in mdx5cv traces. Currents were elicited with an activation protocol shown on the inset of B. (B) Comparison of average currents (top) and inactivation time constants τi (bottom) for the control (open circles, 28 patches) and mdx (filled circles, 33 patches) recordings. Inactivation time constants for potentials below −40 and above 30 mV could not be reliably estimated because of small current amplitude and are not shown. Values are reported as means ± SEM.

