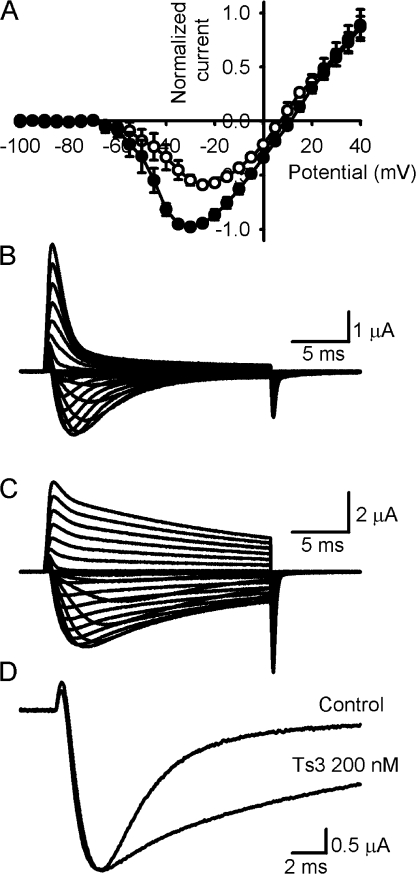
Figure 1.
Effect of Ts3 on sodium currents from Xenopus oocytes expressing Nav1.4. (A) I-V curves obtained before (white circles) and after (black circles) the treatment with 200 nM of Ts3. Both curves were normalized by the maximal current obtained in the presence of toxin. Data shown as mean ± SEM (n = 4). Sodium currents were recorded with 20-ms pulses varying from −100 to +40 mV, which were followed and preceded by a 100-ms pulse to −100 mV. The holding potential was −90 mV. (B) Representative traces obtained in control conditions. (C) Representative traces obtained after the treatment with 200 nM of Ts3. (D) Superimposed recordings obtained at −20 mV before and after the treatment with Ts3. The traces were normalized by the peak value. Experiments were performed at 14°C.

