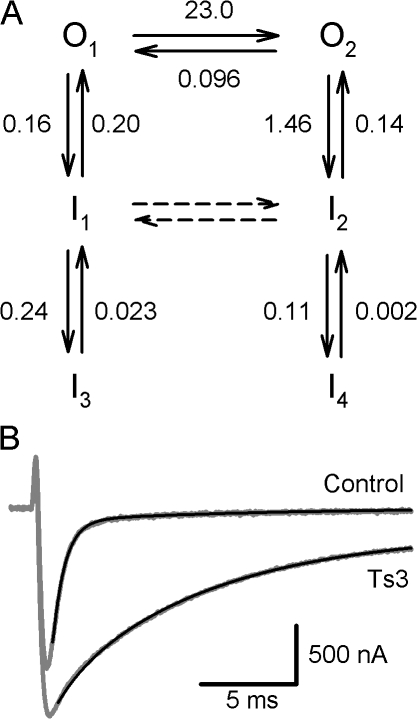
Figure 11.
Kinetic model of inactivation. (A) Kinetic diagram showing the open (O) and inactivated (I) states of the channel. Closed states are not shown and are assumed not to participate on the decay phase of the current at 0 mV (see Discussion). O1 is invariably the first activated state. The numbers indicate the rate constants (in ms−1) obtained by fitting the decay of the sodium current in the presence and absence of Ts3. In the presence of Ts3 the transitions between O1 and O2, and between I1 and I2, are blocked. (B) Experimental records in the presence and absence of Ts3 are superimposed with the theoretical curve calculated using the model and its rate constants.

