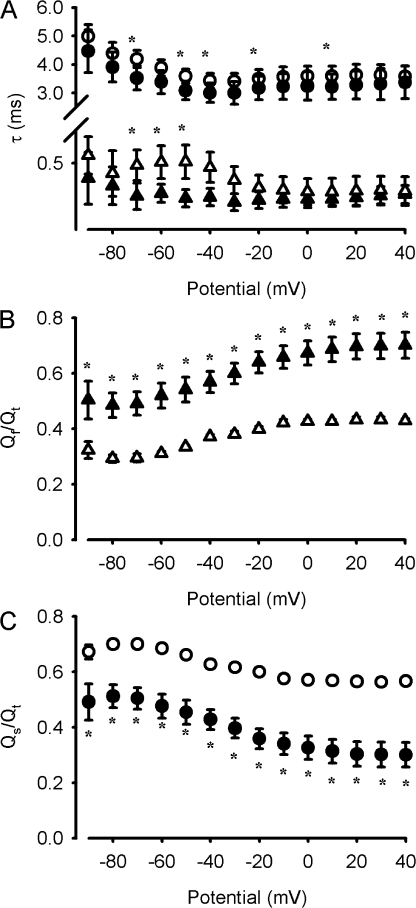
Figure 5.
Effects of Ts3 on the kinetic parameters of the OFF gating currents. The parameters were obtained by fitting the OFF gating current decay with function 1. Gating currents were recorded as described in Fig. 3 A. (A) Fast and slow time constants of the gating current decay. (B) Fraction of charge carried by the fast component of the OFF gating current decay. (C) Fraction of charge carried by the slow component of the decay. White triangles show the fast component in control conditions, black triangles show the fast component in the presence of Ts3, white circles show the slow component in control conditions, and the black circles show the slow component in the presence of Ts3. Note that for some of the potentials, the error bars are smaller than the symbols. Data shown as mean ± SEM, n = 4. *, existence of statistical difference (P < 0.05) between compared groups.

