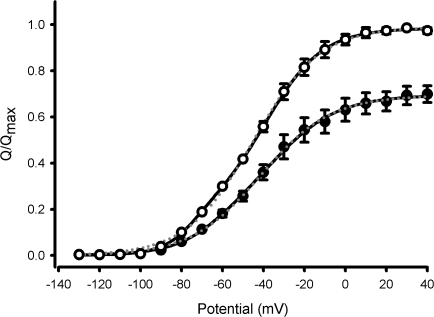
Figure 6.
Effects of Ts3 in the charge–voltage relationship. White symbols represent the Q-V curve obtained in control conditions (mean ± SEM, n = 3), and black symbols the curve obtained after the treatment with 200 nM of Ts3 (mean ± SEM, n = 3). The amount of charge recorded in each potential was normalized to the maximum charge recorded before the treatment with Ts3. Solid black lines are the curves obtained by fitting the data with a double Boltzmann function (function 2). Dotted gray lines are the curves obtained by fitting the data with a single Boltzmann function. Experiments were performed at 14°C.

