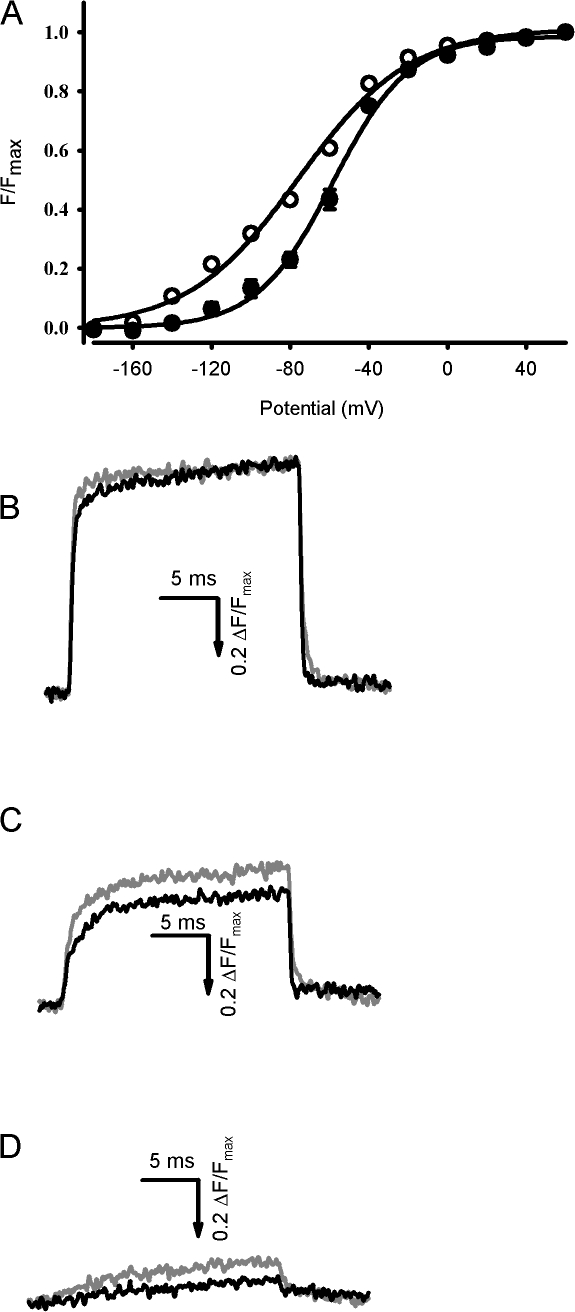
Figure 9.
Effects of Ts3 in the fluorescence changes that track the movement of the S4 segment of domain I of mutant channel S216C stained with TMRM. Traces were recorded as described in Fig. 7. (A) F-V curves obtained before (white symbols) and after (black symbols) the treatment with 200 nM Ts3 (mean ± SEM, n = 3). The fluorescence recorded at each potential was normalized to the maximal fluorescence. Solid lines are the curves obtained by fitting the data with function 3. (B–D) Superimposed representative traces obtained at +60 (B), −60 (C), and −120 (D) before (gray traces) and after (black traces) the treatment with 200 nM of Ts3. The signals are shown as ΔF/F (%), where F is the fluorescence background. The arrow indicates the direction in which fluorescence increases. These experiments were performed at room temperature.

