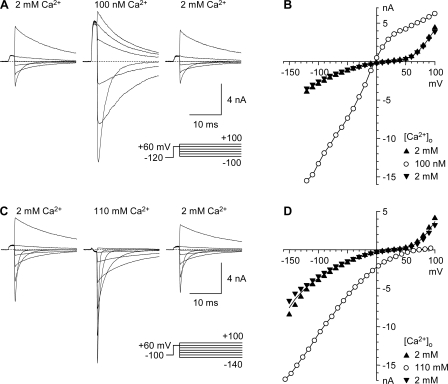
Figure 1.
The instantaneous current–voltage protocol (IIV) used to examine permeation and block. (A and C) Currents recorded in 2 mM Ca2+o, a test solution (100 nM Ca2+o in A, 110 mM Ca2+o in C), and following return to 2 mM Ca2+o (shown from left to right, in 40-mV increments). For this and all figures illustrating current records, dashed lines indicate zero current following leak subtraction. 3 kHz digital Gaussian filter. (B and D) IIV relations measured from the initial amplitude of single-exponential fits (see Materials and methods), following a brief strong depolarization (2 ms to +60 mV) to produce maximal activation with minimal inactivation. Values in 2 mM Ca2+o recorded before and after application of the test solution are shown as upward and downward triangles (respectively), with a line drawn through the average. Voltages in 110 mM Ca2+o (D) are corrected for a junction potential (see Materials and methods).

