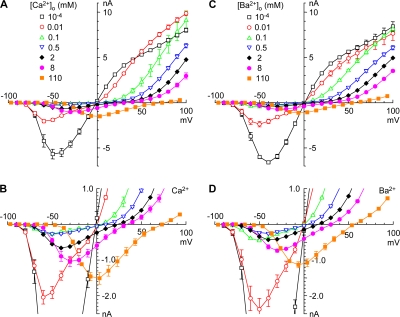
Figure 10.
Effects of Ca2+o and Ba2+o on peak I-V relations. Values were averaged and normalized as described in Materials and methods. Ca2+o (A and B) and Ba2+o (C and D) were varied from 100 nM to 110 mM. 10–12 are based on data from the same cells as 2–5. Note that symbol and color coding for different concentrations is the same for Fig. 10 and Fig. 11, A–D.

