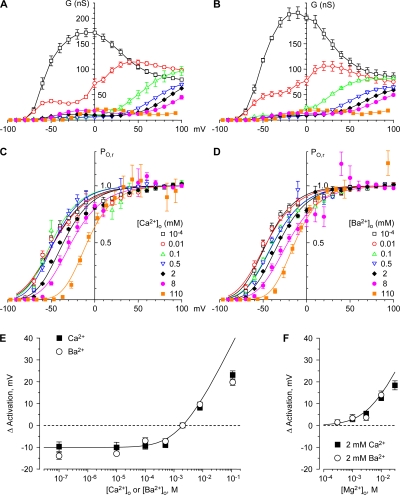
Figure 11.
Effects of Ca2+o, Ba2+o, and Mg2+o on gating. (A and B) Chord conductances; (C and D) channel activation. Activation was measured as the relative channel open probability (PO,r) from the I-V/IIV ratio, normalized (see Materials and methods). Smooth curves in C and D are fits to fourth power Boltzmann relationships. (E and F) Shifts in activation with Ca2+o or Ba2+o (E) and Mg2+o (F). Data are from Fig. S8 A (Ca2+o and Ba2+o) and Fig. S16 A (Mg2+o), except that voltage shifts in Ba2+o are defined with respect to 2 mM Ba2+o (not 2 mM Ca2+o). The smooth curve is the fit to Gouy-Chapman theory with a single uniform surface charge density (see Materials and methods).

