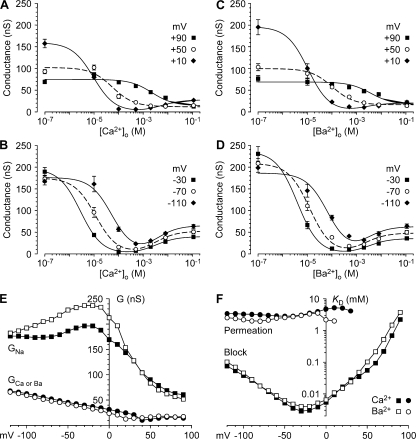
Figure 5.
Analysis of chord conductances. (A–D) Dependence of chord conductance on Ca2+o or Ba2+o, shown for voltages in 40-mV increments. Positive voltages (A and C) and negative voltages (B and D) are shown for Ca2+o (A and B) and Ba2+o (C and D). Smooth curves are described in Materials and methods. (E and F) Analysis of chord conductances as the sum of Na+ and Ca2+/Ba2+ conductances. (E) Maximal conductances; (F) apparent Kd values for permeation (activation of GCa or Ba) and block (inhibition of GNa).

