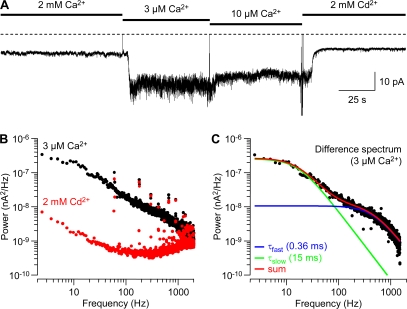
Figure 7.
Noise analysis of block by Ca2+o. (A) “Window” currents at −60 mV in 2 mM, 3 μM, and 10 μM Ca2+o; and in 2 mM Cd2+o. 8-pole analogue Bessel filter at 2 kHz. (B) Averaged power spectra in 3 μM Ca2+o and 2 mM Cd2+o, from ∼60-s records analyzed in 819.2-ms segments, using a Hamming window. (C) The difference between the spectra shown in B, fitted to the sum of two Lorentzian components (440 and 10.5 Hz, corresponding to time constants of 0.36 and 15 ms).

