Figure 6.
Phenotypic and Gene Expression Studies of drip1-1, drip2-1, and drip1 drip2 Mutants.
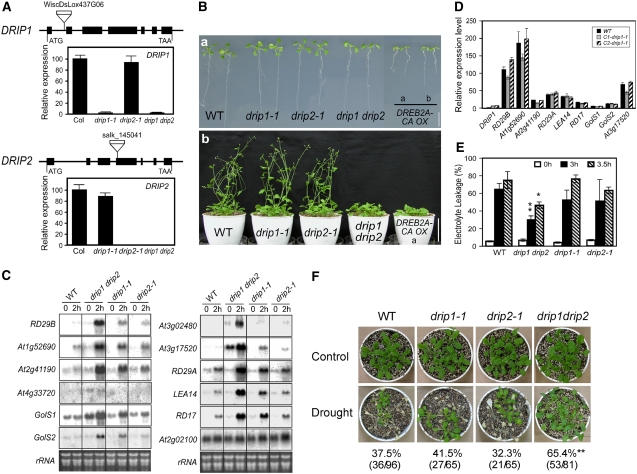
(A) Relative DRIP1 and DRIP2 gene expression in drip1-1, drip2-1, and drip1 drip2 mutants as determined by quantitative RT-PCR. Error bars indicate se (n = 3). Expression of DRIP1 and DRIP2 in the wild type was determined as 100. The gene organizations of DRIP1 and DRIP2 and their T-DNA insertions are shown; exons are indicated as thick lines and introns as thin lines.
(B) Phenotypes of drip1-1, drip2-1, and drip1 drip2 mutants. (a) Growth of 10-d-old seedlings on agar plates. Growth of DREB2A-CA overexpression line b is also shown for comparison (Sakuma et al., 2006a). (b) Three-week-old plants were transferred into soil and photographed at 5 weeks. Growth of DREB2A-CA overexpressor line b is also shown.
(C) Stress-responsive gene expression analysis for the wild type and mutants in response to a 2-h dehydration stress. Total RNA is shown as a loading control.
(D) Complementation of the drip1-1 mutant. The expression level of DRIP1 was determined in the wild type and two independent complementation lines (C1-drip1-1 and C2-drip1-1) under normal conditions by quantitative RT-PCR. Relative expression levels of stress-responsive genes under a 2-h dehydration stress were also compared. For each gene, the expression level in the wild type under nonstressed conditions was defined as 1.0. Error bars indicate se (n = 3).
(E) Leaf electrolyte leakage of the wild type and drip1-1, drip2-1, and drip1 drip2 mutants before and after dehydration stress. Error bars indicate se of three replicates. * P < 0.05, ** P < 0.01, by t test.
(F) Survival rates of wild-type, drip1-1, drip2-1, and drip1 drip2 plants after being exposed to drought stress for 14 to 16 d, which is when the most significant difference was observed. Photographs were taken after a 1-week recovery period subsequent to rewatering. ** P < 0.01, by t test.

