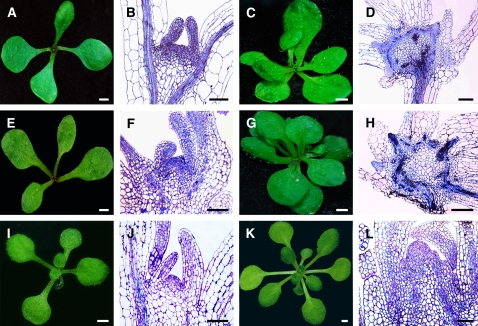
Figure 7.
Comparison of Shoot Meristem Phenotypes.
(A), (E), and (I) Photographs of 14-d-old wus-1 bard1-3 double mutant, CaMV35S∷BARD1 (in wild-type background), and BARD1:C-ter;bard1-3 seedlings, respectively.
(B), (F), and (J) Median longitudinal sections of the same lines.
(C), (G), and (K) Photographs of 25-d-old wus-1 bard1-3, CaMV35S∷BARD1, and BARD1:C-ter;bard1-3 plants, respectively.
(D), (H), and (L) Median longitudinal sections of the same lines. White bars = 1 mm; black bars = 50 μm.

