Figure 8.
Characterization of dcaf1 Mutants.
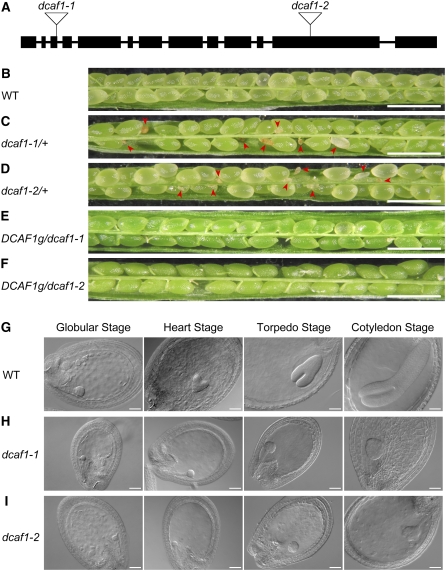
(A) Schematic representation of T-DNA insertions in the Arabidopsis DCAF1 gene. Exons are represented by filled black rectangles, and introns are represented by solid lines. The T-DNA insertion sites of the two mutant alleles are indicated by open inverted triangles, with the assigned allele name of each insertional mutation labeled above.
(B) to (F) Stereomicroscopy images of siliques obtained from self-pollinated wild-type (B), dcaf1-1/+ (C), dcaf1-2/+ (D), DCAF1g/dcaf1-1 (E), and DCAF1g/dcaf1-2 (F) parental plants. Red arrowheads indicate abnormal ovules. Bars = 1 mm.
(G) to (I) DIC images of cleared ovules obtained from self-pollinated wild-type (G), dcaf1-1/+ (H), and dcaf1-2/+ (I) parental plants. The four embryonic developmental stages (globular, heart, torpedo, and cotyledon) are shown from left to right. Bars = 50 μm.

