Figure 2.
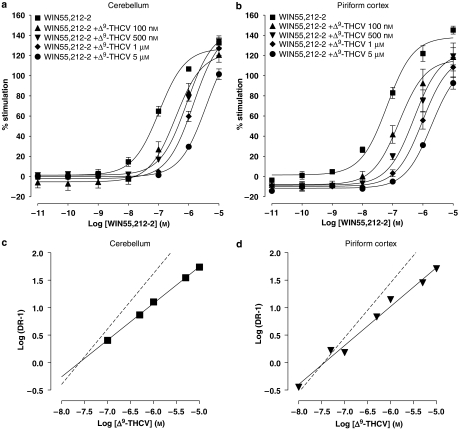
Log concentration–response curves for WIN55,212-2 (10 pM–10 μM) effects on percentage stimulation of [35S]GTPγS binding in the presence of Δ9-THCV (100 nM–5 μM) in (a) cerebellar and (b) PC membranes (both n=3). Plot symbols show mean percentage increase in [35S]GTPγS binding±s.e.mean (n=minimum three trials per agonist concentration used). Note the progressive rightward shifts in WIN55,212-2 concentration–response curves in both cerebellar and PC membranes induced by increasing concentrations of Δ9-THCV, consistent with an antagonistic effect. Schild plots were subsequently constructed for antagonism of WIN55,212-2 by Δ9-THCV in (c) cerebellar and (d) PC membranes, yielding slope and pA2 values given in Table 1. Slopes of unity (dotted lines) are shown for reference. PC, piriform cortex; WIN55,212-2, (R)-(+)-[2,3-dihydro-5-methyl-3-(4-morpholinylmethyl)pyrrolo-[1,2,3-de]-1,4-benzoxazin-6-yl]-1-naphthalenylmethanone mesylate; Δ9-THCV, Δ9-tetrahydrocannabivarin.

