
Figure 3.
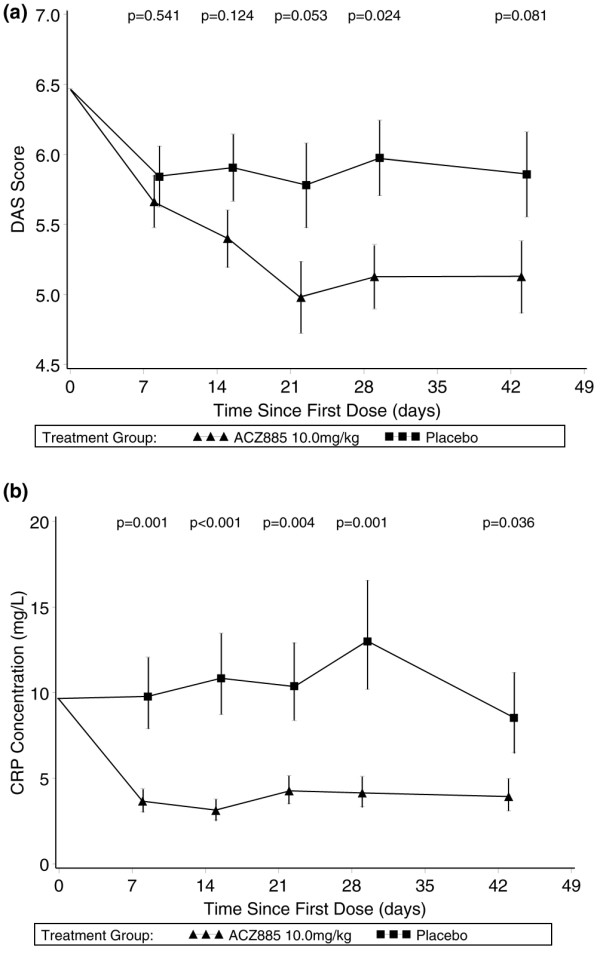
Reduction in disease activity and CRP levels following ACZ885 therapy in RA patients. (a) Mean disease activity (Disease Activity Score using 28 joint counts [DAS28]) levels over time. Baseline adjusted mean and standard error of the mean (SEM) from the repeated measures analysis are presented for patients treated with ACZ885 10 mg/kg (n = 20) and placebo (n = 15). P values for comparison of ACZ885 10 mg/kg versus placebo at each time point are presented. (b) Geometric mean C-reactive protein (CRP) levels over time. Baseline adjusted mean and SEM from the repeated measures analysis are presented after transformation back onto the original scale for patients treated with ACZ885 10 mg/kg (n = 20) and placebo (n = 15). P values for comparison of ACZ885 10 mg/kg versus placebo at each time point are presented. Normal range of CRP was 0 to 8.4 mg/l.