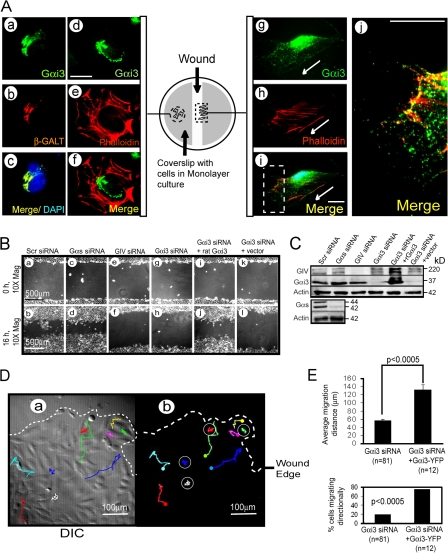
Figure 1.
Gαi3 redistributes to the cell periphery during cell migration and is necessary for cell migration. (A) Distribution of Gαi3 in quiescent (a–f) versus migrating (g–j) HeLa cells after scratch wounding. In quiescent cells, endogenous Gαi3 colocalizes with βGalT in the Golgi (a–c) but not actin (d–f). In migrating cells, Gαi3 is found in puncta that partially colocalize with actin at the leading edge (g–i). Arrows denote direction of migration. Boxed area in i is enlarged in j. HeLa cells were aldehyde fixed 0 (left) and 8 (right) h after scratch wounding, as shown in the diagram, and stained as indicated. Bars,10 μm. (B) Depletion of Gαi3 (g and h) or GIV (e and f), but not Gαs (c and d), impairs wound healing (compare with scrambled siRNA [scr siRNA] controls; a and b). Repletion of hGαi3 by rat Gαi3 (i and j), but not vector alone (k and l), restores this defect. HeLa cells treated as indicated were subjected to scratch wounding and examined immediately after wounding (0 h) or 16 h later (n = 5). (C) Cell lysates from cells treated as in B were immunoblotted to assess the efficiency of siRNA depletion of Gαs (∼90%), GIV (∼85%), or Gαi3 (∼95%) and the expression of rGαi3. Several GIV bands are identified that most likely are different posttranslationally modified forms of GIV because they are specifically depleted using GIV siRNA. (D) Comparative trajectories of Gαi3-depleted cells versus those transfected with Gαi3-YFP were followed by live cell imaging for 8 h after wounding. Representative cells at the advancing edge of the wound (dashed line) were traced using a cell tracker application on videos obtained of transfected (solid squiggles) or untransfected (circles) cells through the YFP channel (b) or a simultaneously recorded DIC channel (a; Video 1, available at http://www.jcb.org/cgi/content/full/jcb.200712066/DC1). (E) Bar graphs showing the distance covered by cells in D analyzed by the cell-tracker application (top graph) and the percent of untransfected Gαi3-depleted cells versus Gαi3-depleted cells transfected with rGαi3-YFP that displayed directional migration (bottom graph). Results are shown as mean ± SEM (n = 3).

