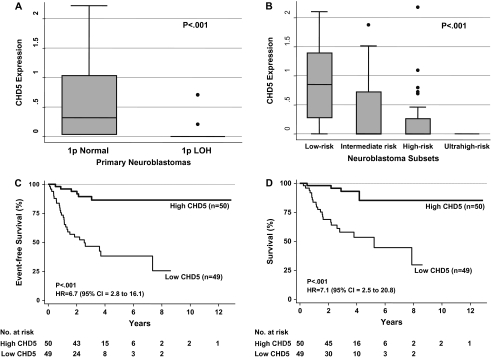
Figure 5.
Association of CHD5 expression with risk factors and outcome in primary neuroblastomas. A) Normalized CHD5 expression in 101 primary neuroblastomas stratified based on the presence (n = 26) or absence (n = 75) of 1p deletion (two-sample t test, P < .001). B) Association of normalized CHD5 expression with the risk group (low, intermediate, high, and ultrahigh) as defined above and in (23). Briefly, for this study, low-risk patients were defined as infants (<1 year of age) with stage 1 or 2 disease by the International Neuroblastoma Staging (INSS) system (24) and favorable biologic features. Intermediate-risk patients were almost all patients with INSS stage 3 disease who were older than 1 year. High-risk patients were defined as those with INSS stage 3 or 4 (only two had stage 3) disease who were older than 1 year. High-risk patients were divided into two subsets: those without MYCN amplification (high risk) and those with MYCN amplification (ultrahigh risk). Twenty-eight were low-risk, 21 were intermediate-risk, 32 were high-risk (without MYCN amplification), and 20 were ultrahigh risk (with MYCN amplification) patients. Survival data were available for 99 of the 101 patients. The association of CHD5 expression with risk group was assessed (analysis of variance, P < .001). The box stretches from the 25th to 75th percentile. The median is shown with a line across the box. The whiskers extend to the highest and lowest observed values that are lower than and higher than 1.5 times the interquartile range from the third and first quartile values. The solid circles are outlying values beyond the whisker edges. C) Association of CHD5 expression with event-free survival in univariate analysis (log-rank, P < .001). D) Association of CHD5 expression with overall survival in univariate analysis (log-rank, P < .001). HR = hazard ratio; CI = confidence interval. All P values are two-sided.

