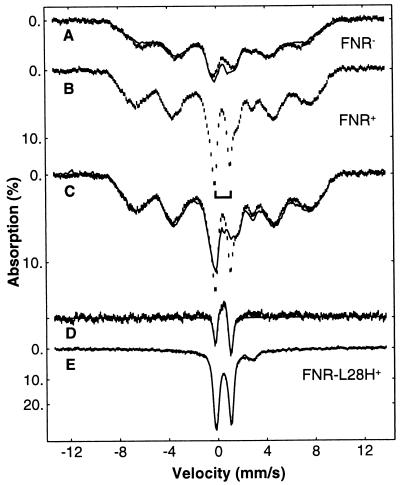
Figure 2.
Mössbauer spectra of E. coli cells recorded at 1.5 K (A–C) and 4.2 K (E). (A) FNR− cells, anaerobic (dash marks) and after exposure to air (solid line). (B) Anaerobic FNR+ cells. Bracket marks 4Fe-FNR. (C) Anaerobic FNR+ cells from B (dash marks) and FNR+ cells exposed for 15 min to air (solid line). (D) Difference spectrum of the anaerobic FNR+ sample minus the spectrum of the air-exposed FNR+ sample, by using the spectra shown in C. The solid line in D is a theoretical difference spectrum assuming 4Fe-FNR and 2Fe-FNR in 1:1 cluster ratio. (E) Whole-cell spectra of FNR-L28H mutant, anaerobic (dash marks), and exposed to air for 20 min (solid line).

