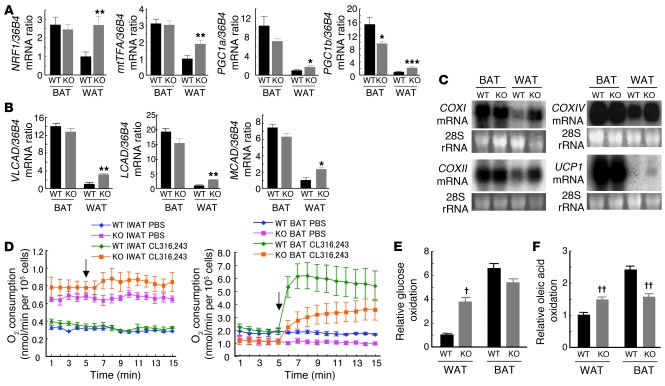
Figure 4. Mitochondrion-related gene expression and metabolic rate in WAT of FSP27-knockout mice.
(A and B) Quantitative RT-PCR analysis of the expression of genes related to mitochondrial biogenesis (A) or to FFA oxidation (B) in WAT and BAT of 20-week-old wild-type and FSP27-KO mice. Data were normalized by the amount of 36B4 mRNA and expressed relative to the corresponding value for WAT of wild-type mice; data are mean ± SEM (n = 4). *P < 0.05, **P < 0.01, ***P < 0.001 versus the corresponding value for wild-type mice. (C) Northern blot analysis of mRNAs for COXI, COXII, COXIV, and UCP1 in WAT and BAT of 14-week-old wild-type and FSP27-KO mice. (D) Oxygen consumption by adipocytes isolated from inguinal WAT (IWAT; left panel) or interscapular BAT (right panel) of wild-type and FSP27-KO mice. Arrows indicate the addition of the β3-adrenergic agonist CL316,243 or vehicle (Ca2+- and Mg2+-free PBS). Data are mean ± SEM of values from 4 independent experiments. (E and F) Glucose (E) and oleic acid (F) oxidation in adipocytes isolated from epididymal WAT or interscapular BAT of wild-type and FSP27-KO mice. Data are expressed relative to the corresponding value for WAT of wild-type mice and are mean ± SEM of values from 4 WT or 3 KO independent experiments. †P < 0.05, ††P < 0.01 versus the corresponding value for wild-type cells.

