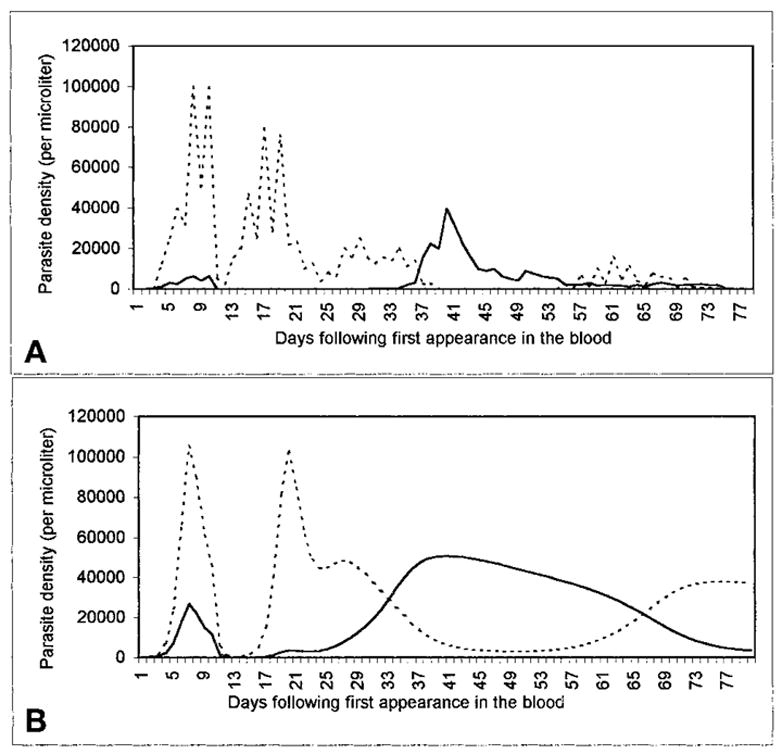
Figure 5.

A, an infection-history curve from the malariatherapy treatment of a neurosyphilis patient, case 271–1126 (Boyd and Kitchen7). The vertical axis shows asexual-form parasitemia from microscopy-based estimates; the horizontal axis shows days. The time course of P. vivax (solid line) and P. falciparum (dotted line) parasitemia is shown following the inoculation of a patient (8 days earlier) by the feeding of a cage of Anopheles stephensi that had fed 28 days before on a patient infectious for P. falciparum and 21 days before on a patient infectious for P. vivax. The estimated detection threshold is 10 parasitized erythrocytes/μl. 10.5-grain doses of quinine were administered on days 8 and 9. B, a similar dynamic pattern from our model, incorporating treatment on day 8 with subcurative quinine (for which the minimum parasiticidal concentration [MPC]falciparum is reached in 2 days, the MPCvivax in 4). Here, x = y = 0, cs = 0.001, cn = 0.0001, ss = 0.0005, sn = 0.1.
