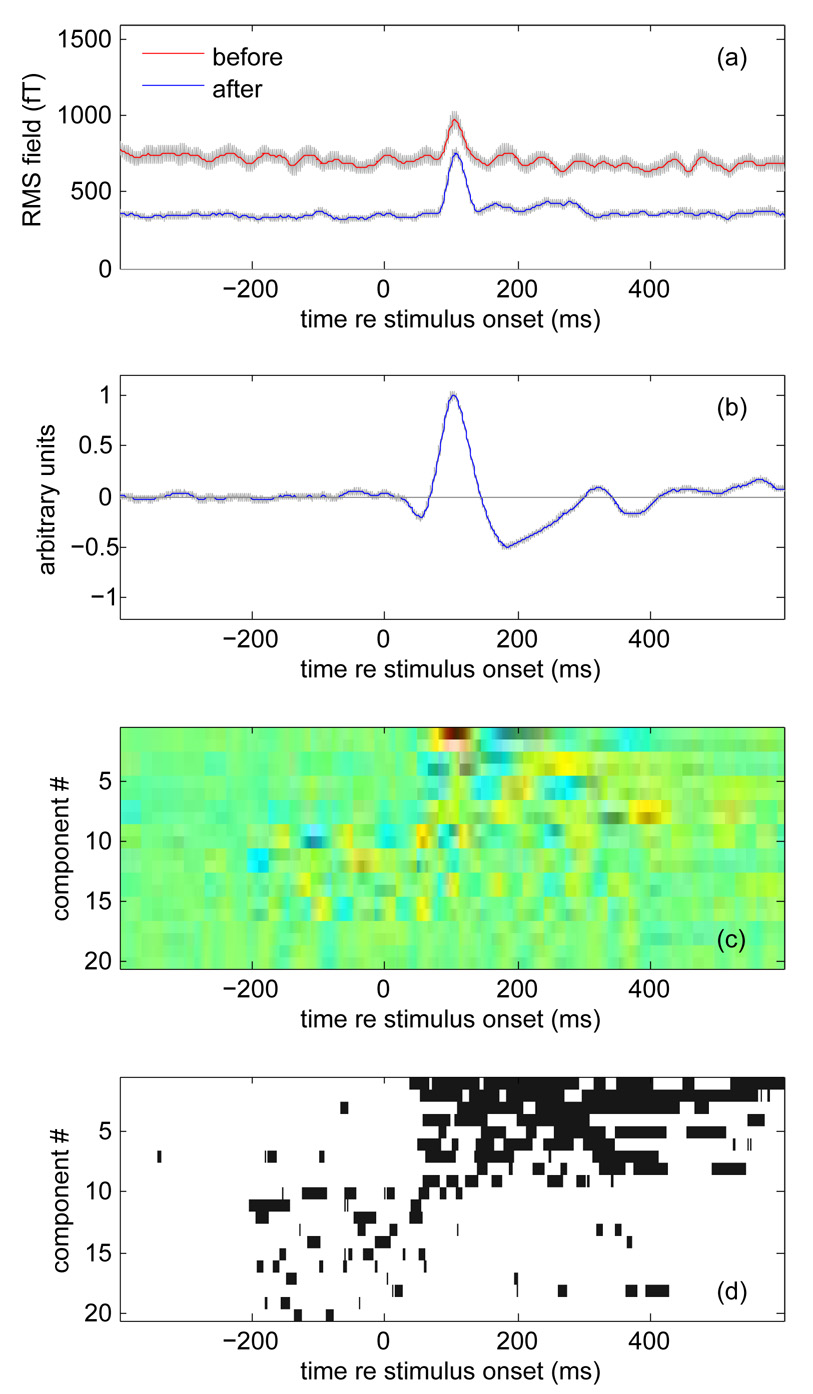
Fig. 2.

Effect of denoising on MEG responses to repeated auditory stimuli (200 ms noise bursts). (a) RMS over channels and trials before (red) and after (blue) denoising. Gray bands indicate ±2 standard deviations of the bootstrap-resampled mean. (b) Time course of best (most reproducible) component averaged over trials. The gray band (hardly visible) indicates ±2 standard deviations of the bootstrap-resampled mean. (c) Time-course of the first 20 components averaged over trials, coded as color. Each component was normalized and then multiplied by the square root of its power. (d) Map of time intervals for which each component differs from 0 by more than 4 times the standard deviation of the bootstrap-resampled mean. Intervals for which this plot is white are unlikely to represent stimulus-evoked activity, as are intervals that precede stimulus onset.
