
Fig. 4.
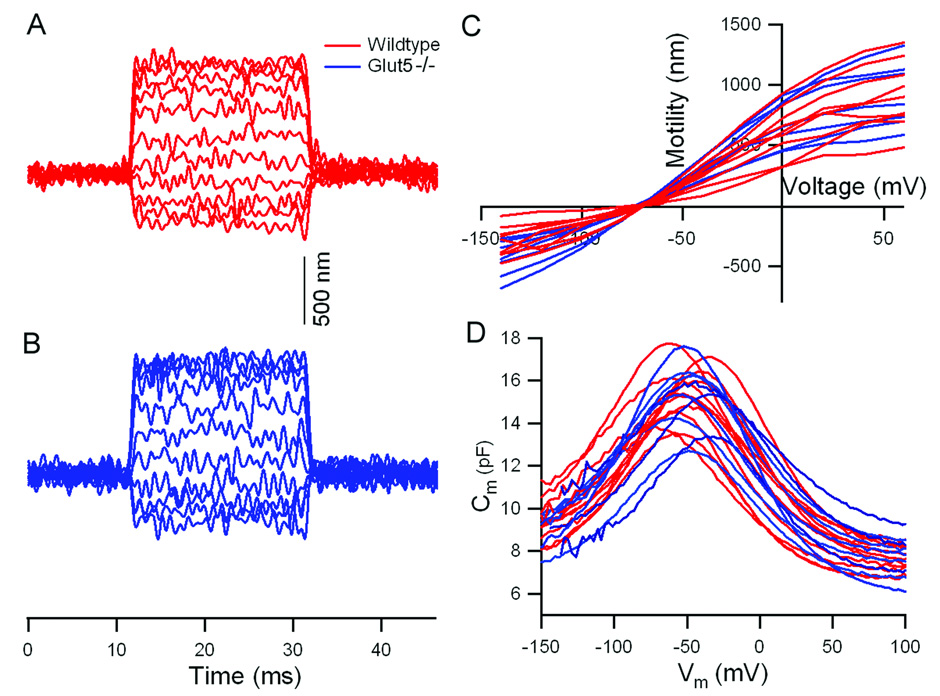
Motility and NLC measured from +/+ and Glut5−/− OHCs in vitro. (A, B) Representative examples of electromotility from +/+ (red) and Glut5−/− (blue) OHCs measured when the membrane potential was stepped from a holding potential of −70 mV to different values (from −140 to 60 mV) at 20-mV increments. Contraction is plotted upward. (C) Individual motility functions obtained from +/+ (red) and Glut5−/− (blue) OHCs. (D) Individual NLC curves (+/+ in red, Glut5−/− in blue) measured using the two-sine voltage stimulus protocol (10mV peak at 390.6 and 781.2Hz) with subsequent fast Fourier transform-based admittance analysis.