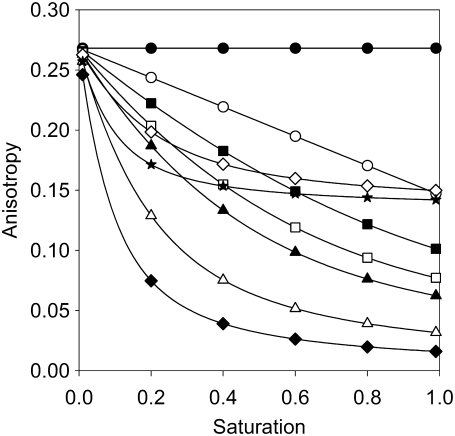
FIGURE 2.
Theoretical curves show the dependence of fluorescence anisotropy on the saturation of binding sites as a function of cluster size and monomer percentage. The anisotropy of fluorescence antibodies as a function of the saturation of binding sites was determined according to Eq. 7, assuming a limiting anisotropy of 0.27. The calculation was performed for several cluster sizes, with no monomers present (numbers indicate number of proteins in the homocluster: •, 1; ○, 2; ▪, 3; □, 4; ▴, 5; Δ, 10; ♦, 20), and for the case when half of the proteins are monomers (⋄, 10; ★, 20).

