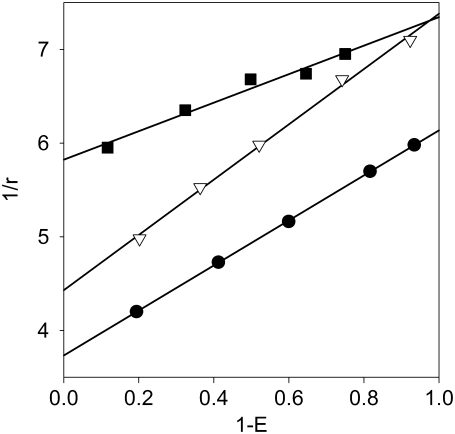
FIGURE 4.
Determination of limiting anisotropy. Cells were labeled with saturating concentration of the primary antibody (Alexa488-tagged trastuzumab, •; EGFR455, ▪; or Mab528, ▿) followed by secondary labeling by Cy3-anti-human F(ab′)2 or Alexa546-anti-mouse F(ab′)2. The fluorescence anisotropy and the hetero-FRET efficiency were calculated for each sample, and the y-intercept of the line fitted on the Perrin plot yielded the reciprocal of the limiting anisotropy.

