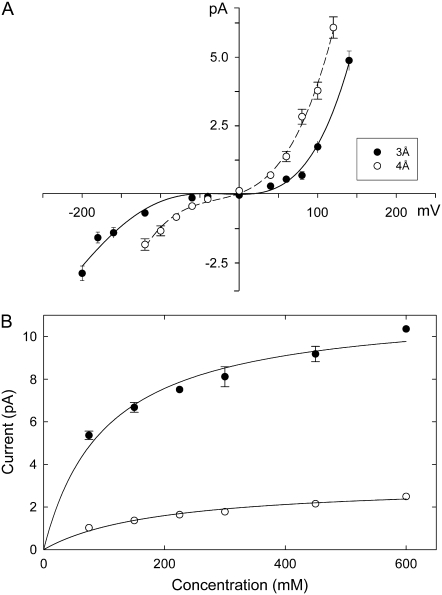
FIGURE 3.
Current-voltage-concentration profiles of NaK. (A) The current-voltage relationships are obtained with solutions of 150 mM KCl in each reservoir. The radii of the intracellular gate are set at 3 Å (solid circles) and 4 Å (open circles). Error bars in this and the following figures have a length of mean ±2 SE and are not shown when they are smaller than the data points. (B) Current-concentration curves are obtained with applied potentials of ±160 mV. Inward and outward currents are shown as open and solid circles, respectively. Lines are fitted from the Michaelis-Menten equation.

