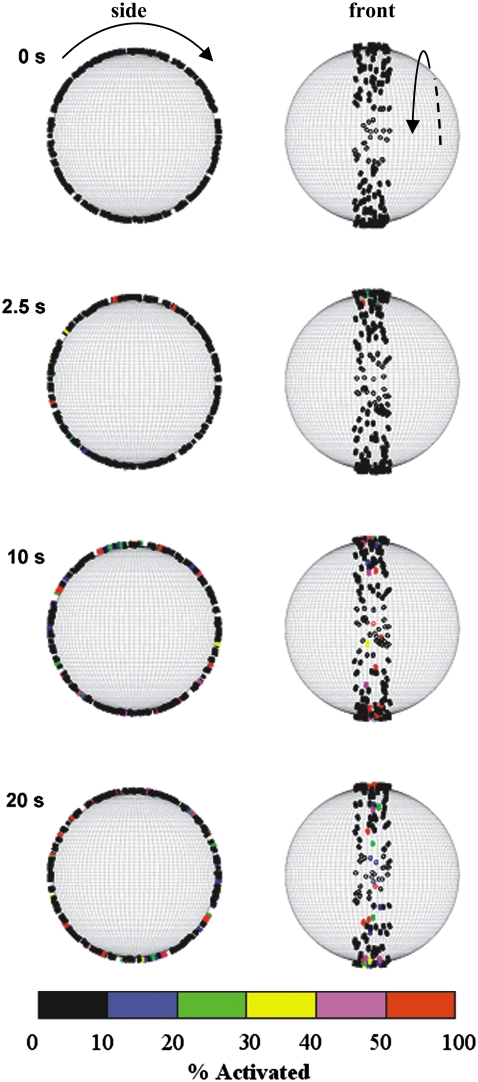
FIGURE 4.
Visualization of activating and arresting cell at 0, 2.5, 10, and 20 s. The left-hand column of images represents a side view of a cell rolling to the right. The right-hand column depicts the cell rolling toward the reader. On the surface of the cell, MVs are drawn as individual cylinders in a color corresponding to the degree of LFA-1 activation.

