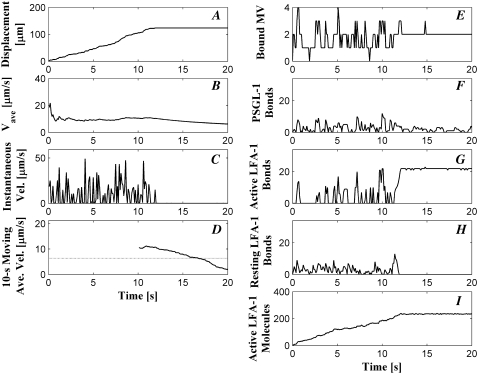
FIGURE 5.
Cell-level simulation output for cell depicted in Fig. 4. (A) Displacement; (B) Cumulative average rolling velocity; (C) Instantaneous velocity; (D) 10-s backward moving average velocity; (E) Number of bound MVs; (F) Total number of PSGL-1 bonds; (G) Total number of active LFA-1 bonds; (H) Total number of resting LFA-1 bonds; and (I) Total number of active LFA-1 molecules.

