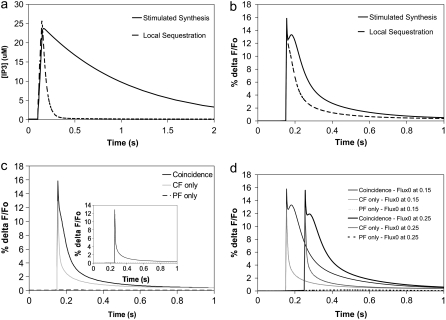
FIGURE 8.
(a) IP3 concentration for 4 PF stimuli at 80 Hz beginning at t = 0.1 s in the adapted compartmental model. The parameters were chosen to fit the spine IP3 dynamics for local PIP2 sequestration (dashed curve) and stimulated PIP2 synthesis (solid curve) in our 3D model using the constructed geometry. Local sequestration and stimulated synthesis are able to produce similar amplitudes of IP3, but with different durations. (b) Ca transients for coincident activation of Purkinje neuron spine by 4 PF stimuli beginning at t = 0.1 s and 1 CF stimulus at 0.15 s in the adapted compartmental models produced by parameters corresponding to local PIP2 sequestration (dashed curve) and stimulated PIP2 synthesis (solid curve). (c) Ca transients for 4 PF stimuli only (dashed line), 1 CF stimulus only (shaded line), or coincident activation by 4 PF stimuli and 1 CF stimulus (solid line) in the adapted compartmental model with parameters corresponding to local PIP2 sequestration. The train of 4 PF stimuli begins at 0.1 s; the CF stimulus occurs at 0.15 s. (Inset) As above, but with calcium influx at 0.25 s. (d) Timing dependence for the stimulated synthesis mechanism. Ca transients for 4 PF stimuli only (partially dashed line), 1 CF stimulus only (lightly shaded line), or coincident activation by 4 PF stimuli and 1 CF stimulus (solid line). The train of 4 PF stimuli begins at 0.1 s; the CF stimulus occurs at 0.15 s for the curves on the left and at 0.25 s for the curves on the right.

