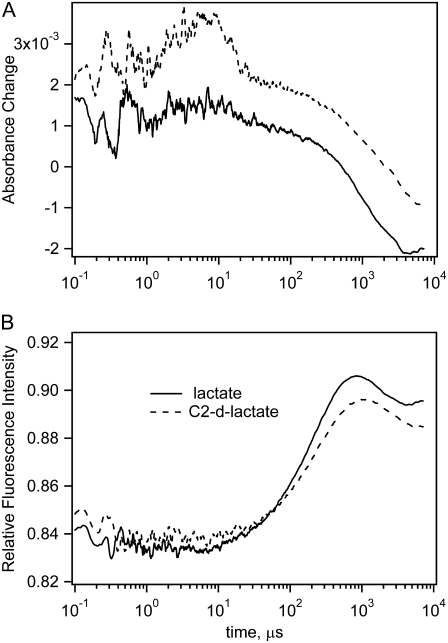
FIGURE 6.
Absorption (upper graph) and fluorescence (lower graph) kinetics for reaction systems with LDH 0.46 mM, NAD+ 0.5 mM, lactate 5 mM (total initial concentrations) (solid line) or C2-deuterated lactate (dotted line). Temperature jump from 24.0°C to 32.5°C. A bump between 1 and 20 μs in the top graph of the absorption kinetics is an artifact.

