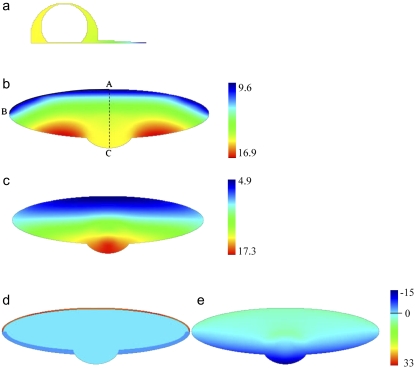
FIGURE 2.
Steady-state G-actin distributions (a–c, in μM units) and spatial distributions of the net assembly (d–e, term in μM/s units) with the G-actin source along the lamellipodial rear and sink along the leading edge (a: view from the side; b and d: view from above) and with the source and sink distributed throughout the lamellipod (c and e: view from above). The lines AB and AC show the line profiles of the G-actin concentrations in Fig. 3.

