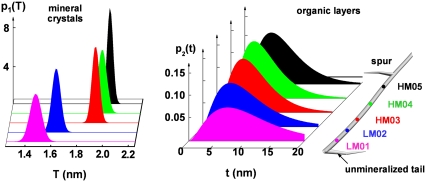
FIGURE 3.
Evolution of the mineral crystal packing in the collagen matrix at different degrees of mineralization. The intramuscular shad bone sample (right) has roughly a fiber shape with an unmineralized tail at the end and a spur in the middle. The extent of mineralization gradually increases from the interface between the two portions (unmineralized and mineralized) to the spur. The thickness distributions of the mineral crystals are plotted as narrow Gaussians (Eq. 2) and the thickness distributions of the intercalated organic layers are plotted as Γ-distributions (Eq. 4). Note that the scale range for the mineral thickness distribution (left) is 1/20 of that for the organic layer thickness distribution (right).

