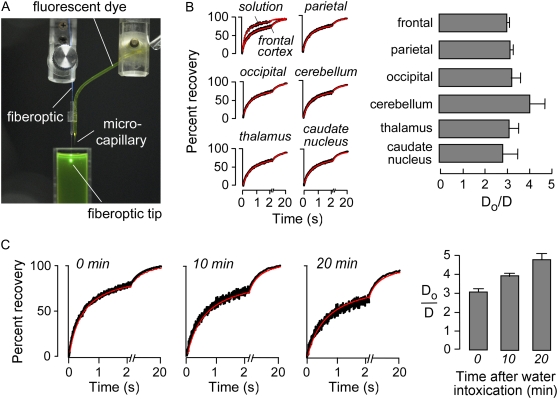
FIGURE 1.
Experimental measurement of calcein diffusion in brain ECS in living mice. (A) Experimental setup, showing dual-lumen device housing a barrel to guide the microfiberoptic adjacent to a microcapillary for dye delivery. Conical illumination volume is produced at the fiberoptic tip. (B, left) Representative fluorescence recovery curves for microfiberoptic photobleaching measurements of calcein diffusion in ECS at indicated regions of mouse brain. (B, right) Averaged Do/D for calcein diffusion in aCSF versus brain ECS (SE, n = 4). (C, left) Recovery curves for calcein diffusion in cerebral cortex (400 μm beneath brain surface) before and at 10 and 20 min after intraperitoneal water administration. (C, right) Averaged data (SE, n = 4).

