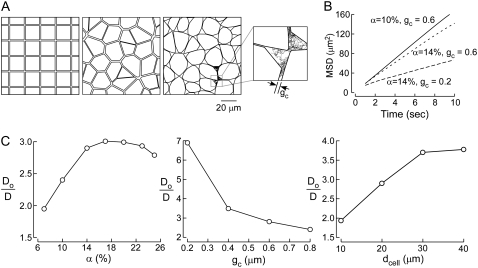
FIGURE 2.
Two-dimensional models of diffusion in brain ECS. (A) Schematic of two-dimensional models: (left) square lattice model, α = 14%, gc = 1.45 μm; (middle) Voronoi cell model, α = 14%, gc ∼ 1.5 μm; and (right) Voronoi cell model with lakes at multicell contact points, α =14%, gc ∼ 0.6 μm. Inset at right shows random-walk path of a diffusing point-like particle. (B) Examples of MSD plots computed with the Voronoi cell-lake model. Parameters: dcell = 20 μm, with indicated gc and α. (C) Model behavior, showing Do/D for the Voronoi cell-lake model as a function of (left) α, (middle) gc, and (right) cell diameter, dcell. Parameters: (left) dcell = 20 μm, gc = 0.6 μm; (middle) α = 14%, dcell = 20 μm; (right) α = 14%, gc = 0.6 μm.

