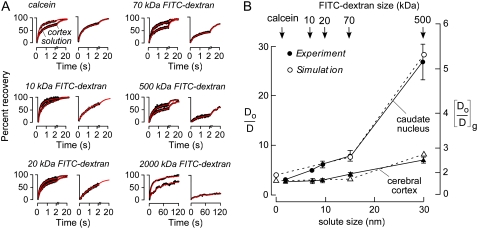
FIGURE 6.
Model comparisons with experimental data for solute size-dependent diffusion in mouse brain ECS. (A) Representative fluorescence recovery curves of indicated fluorescent dyes in cerebral cortex (left) and caudate nucleus (right). (B) Summary showing Do/D for ECS diffusion as a function of solute size (dsolute) in cerebral cortex (triangles) and caudate nucleus (circles) (SE, n = 5). Experimental data (solid) and simulated results (open) are overlaid. Simulation parameters: (gcx, gcy, gcz) = (40, 40, 40) nm for cerebral cortex, (gcx, gcy, gcz) = (10, 25, 45) nm for caudate nucleus, α ∼ 20%, dcell = 5 μm, wc = 90 nm.

