FIGURE 9.
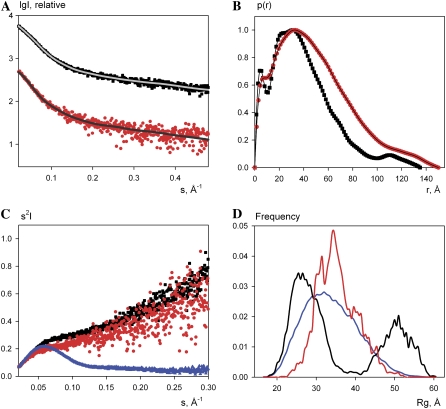
SAXS measurements on hNL3-cyt. (A) X-ray scattering patterns of hNL3-cyt under denaturing (•) and nondenaturing conditions (▪). The fits of the ensembles selected by EOM are displayed as gray lines. (B) Distance distribution functions of the measurements shown in panel A. (C) Kratky plots (red and black traces) derived from the data in panel A and of the globular protein, BSA (blue trace), which served as a folded control. (D) Radii of gyration distributions of hNL3-cyt under denaturing (red line) and nondenaturing conditions (black line) and comparison with a pool of randomly generated structures (blue line).

