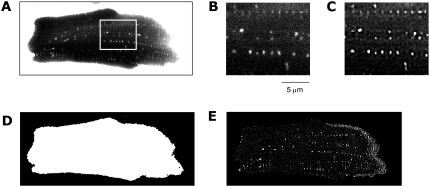
FIGURE 1.
Image data and processing. (A) An image of a left ventricular myocyte was obtained by applying confocal microscopy and dextran-fluorescein as a marker of the extracellular space. The image consists of 896 × 356 pixels and is part of a stack of 130 images. Enlargement of the region marked in A shows cross sections of t-tubules (B) before and (C) after deconvolution. Image segmentation and correlation led to (D) a mask image and (E) highlighting of tubular structures, respectively.

