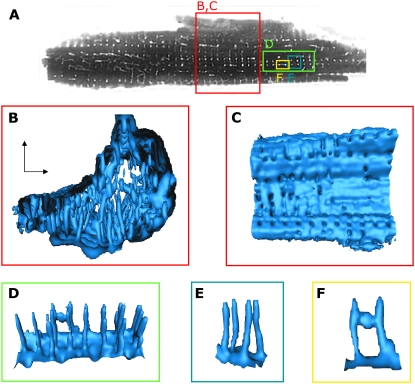
FIGURE 4.
Visualization of t-system in myocyte based on dextran-fluorescein straining. (A) Cross-sectional image indicates invaginations of the sarcolemma. (B) 3D visualization of cell interior reveals that t-tubules penetrate mostly from bottom and top of the cell. (C) A view from the exterior on the sarcolema indicates that t-tubule ostia are partly regularly organized, but in some regions ostia are missing. (D and E) In part, regions with regularly spaced t-tubules of simple topology are exhibited. (F) An anastomosis forming a longitudinal connection between two t-tubules is shown.

