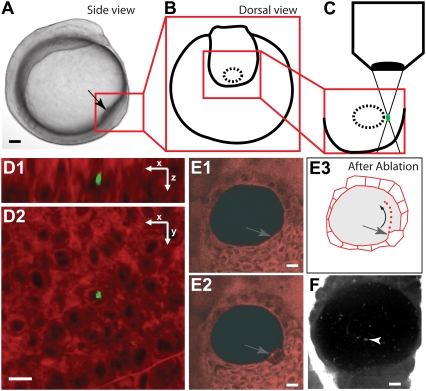
FIGURE 1.
Femtosecond laser ablation procedure for flow fluorescent seeding. (A) Side view of a zebrafish embryo at the stage of ablation. The box outlines the location of the KV. (B) Schematic view of the KV before the ablation (dorsal view). (C) Magnified region of the KV corresponding to the boxed region in B during the ablation step, showing the laser excitation in the tissue. (D) Two views, in x-z (D1) and in x-y (D2), showing the 3D-confined ablation (green, <5 μm in each direction) generated 70 μm deep inside a dye-loaded embryo. The green fluorescence is generated as a result of the laser ablation. (E) Results of the ablation when performed on the cells lining the KV (gray arrows), raw images (E1 and E2), depicting the cells before (E1) and after ablation (E2 and E3). The drawing (E3) illustrates the flow seeding after laser ablation. (F) Fast confocal microscopy allows imaging of the fluorescent microdebris (white arrowhead) seeding the flow. Black and white scale bars 50 μm and 10 μm, respectively.

