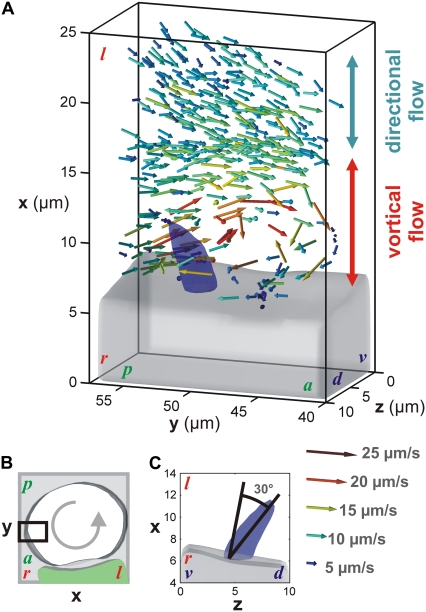
FIGURE 3.
Velocity vector map around a single cilium extracted from 3D particle tracking (100 tracks). (A) Dorsal view of the velocity field surrounding a beating cilium on the right side of the vesicle (black box in B, same vesicle as in Fig. 2 A) and showing a transition between directional and vortical flow close to the cell surface. The gray volume represents the cell surface and the blue volume the cilium position. (C) Posterior view showing the 30° dorsal tilt of the beating axis. The vector map corresponds to the accumulation of instantaneous particle velocities recorded at different time points. The color of the arrows encodes for the norm of the velocity vectors. d, dorsal; v, ventral; a, anterior; p, posterior; l, left; and r, right. The axis scales and position are kept as in Fig. 2 A.

