
Figure 6. Mst1 as a mediator of caspase activation to MAPKs phosphorylation during TRAIL treatment.
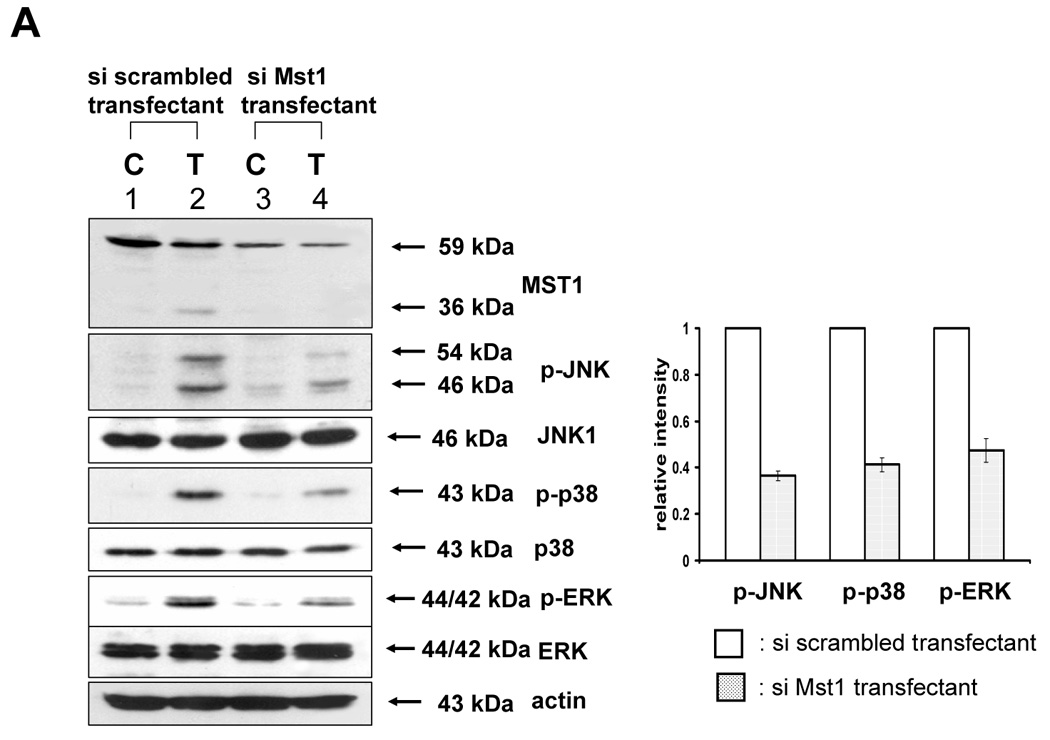
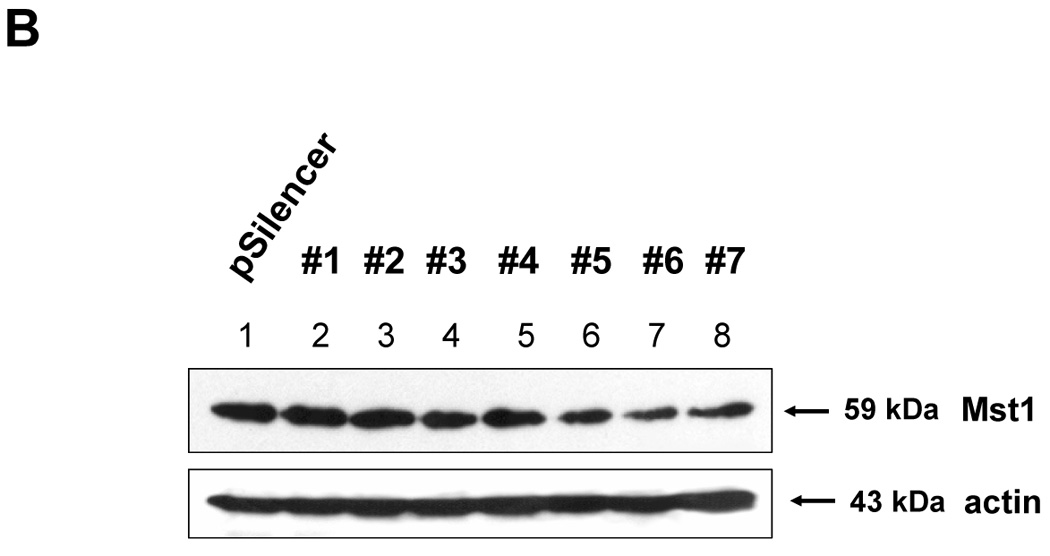
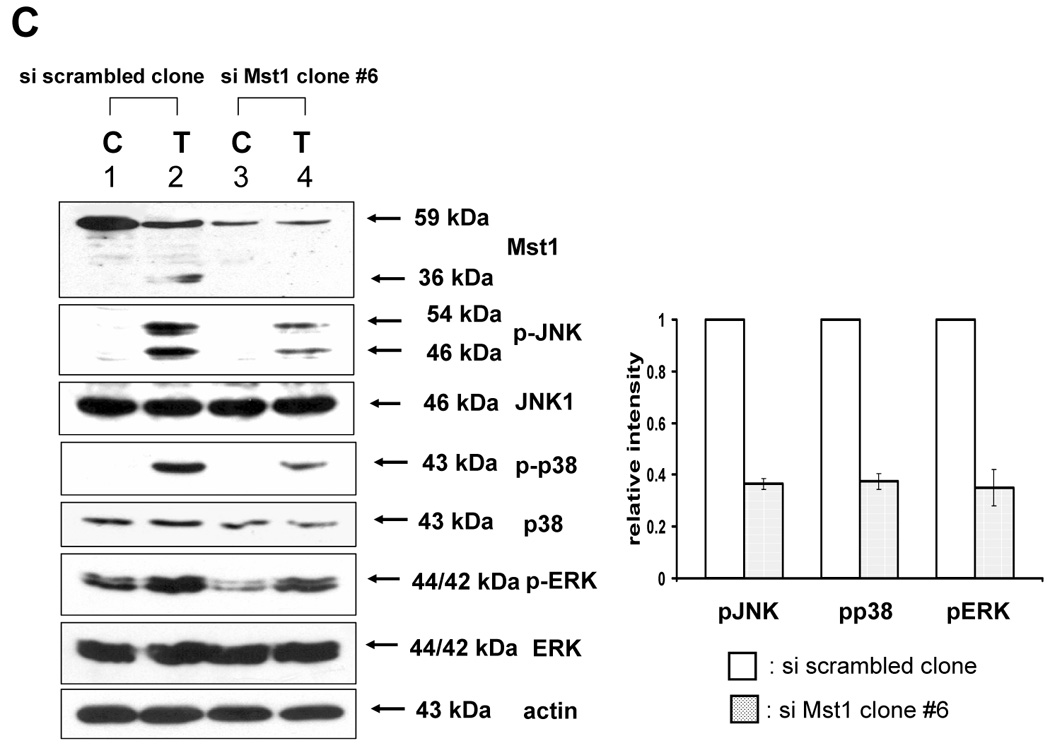
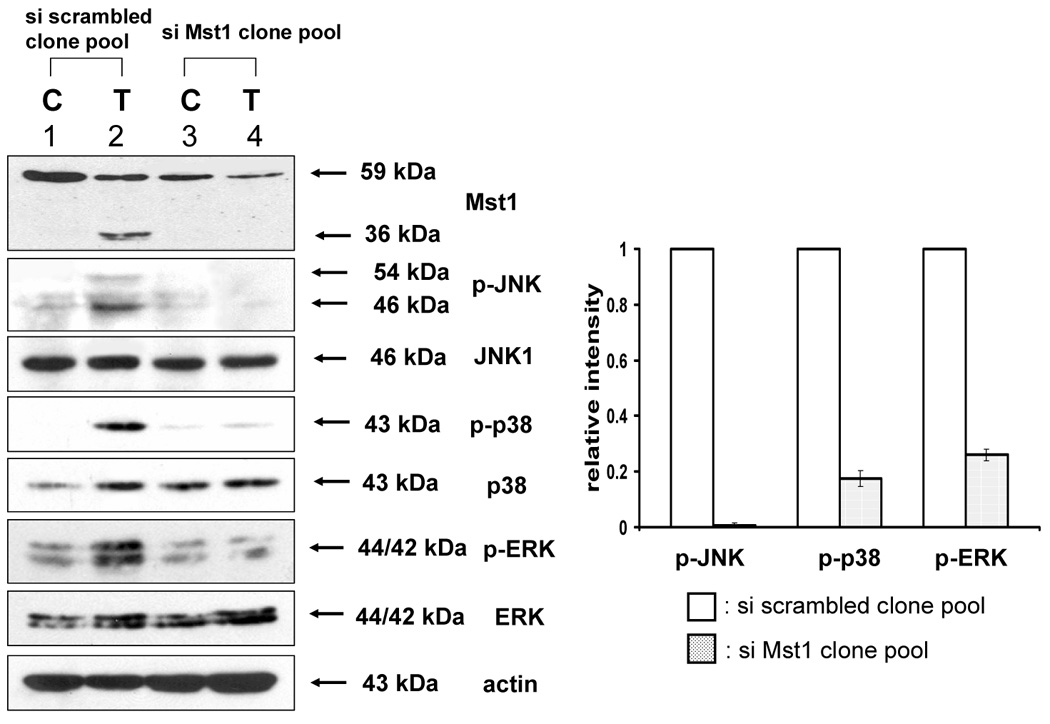
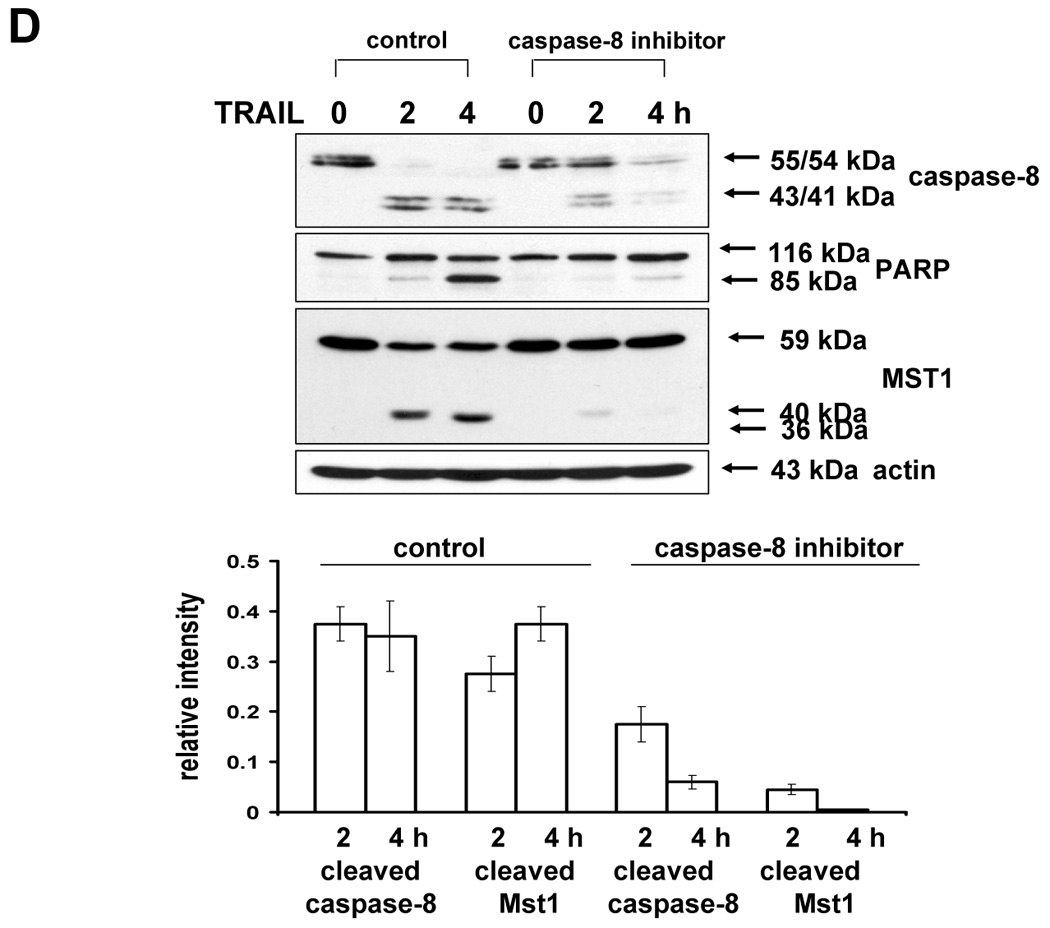
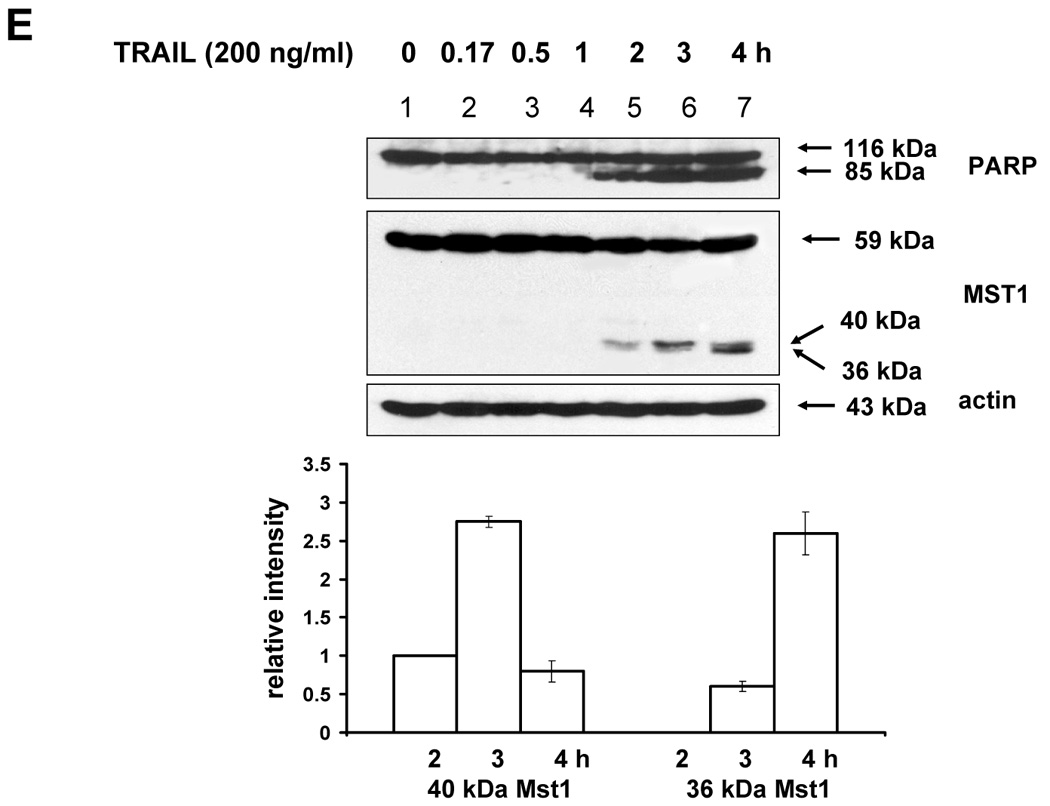
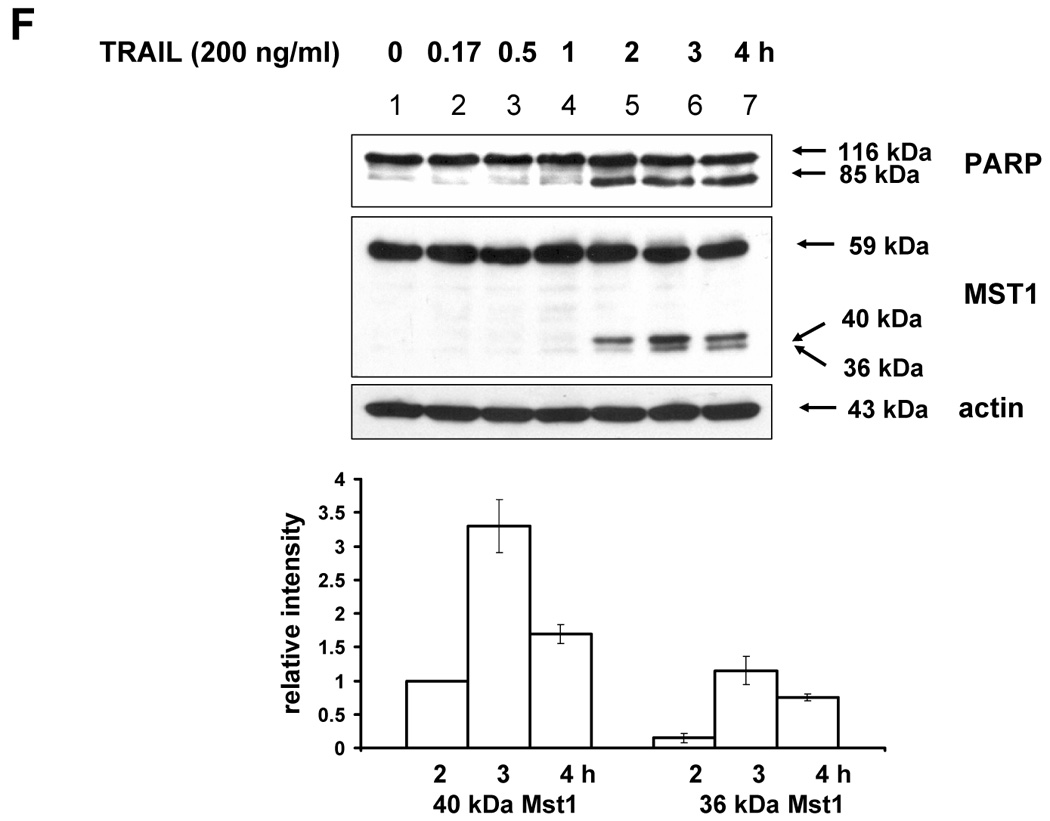
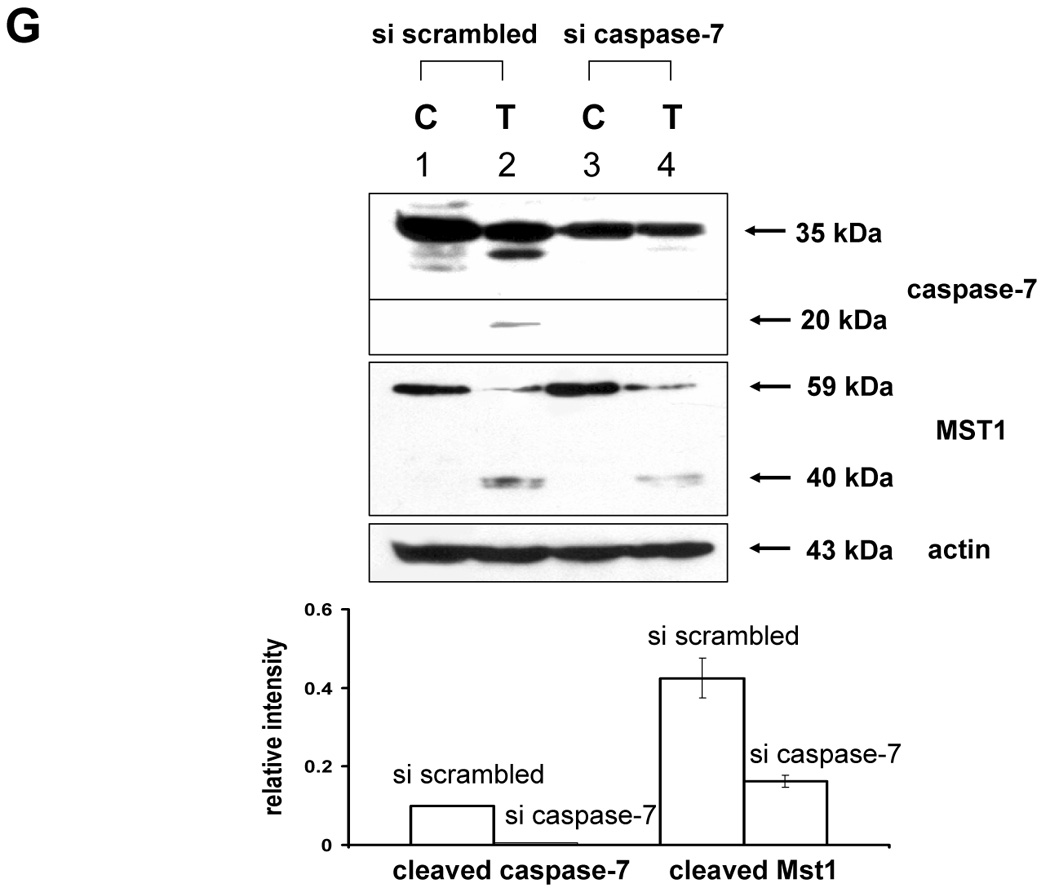
(A) MAPKs phosphorylation induced by TRAIL treatment (200 ng/ml, 4 h) was examined after transfection of control vector (pSilencer) or pSilencer-siMst1 into DU-145 cells. Left panel: Western blot analysis, C, control; T, TRAIL. Right panel: The ratio of the phosphorylated MAPKs to total protein of corresponding MAPKs in TRAIL-treated si scrambled plasmid-transfected cells was set equal to 1, and the ratio of the phosphorylated MAPKs to total protein of corresponding MAPKs in TRAIL-treated si caspase-7 plasmid-transfected cells was compared to this. Data are expressed as mean ± SE of the densitometry data from three independent experiments. (B) Immunoblots were made of Mst1 expression in control vector transfected (pSilencer) or pSilencer-siMst1 stably transfected single cell clones from DU-145 cells. Lysates containing equal amounts of proteins (20 µg) were separated by SDS-PAGE and immunoblotted with anti-Mst1 antibody. (C) Control plasmid (pSilencer) or pSilencer-siMst1 stably transfected cells (clone #6) or a pool of selected clones (#6, #7, and #8) was treated with TRAIL (200 ng/ml) for 4 h, and phosphorylation of MAPKs was examined. Left panel: Western blot analysis, C, control; T, TRAIL. Right panel: The ratio of the phosphorylated MAPKs to total protein of corresponding MAPKs in TRAIL-treated si scrambled plasmid-transfected stable cell clone or clone pool was set equal to 1, and the ratio of the phosphorylated MAPKs to total protein of corresponding MAPKs in TRAIL-treated si Mst1 plasmid-transfected stable clone or pool was compared to this. Data are expressed as mean ± SE of the densitometry data from three independent experiments. (D) Mst1 cleavage was examined in the presence of caspase-8 inhibitor (Z-IETD-FMK 20 µM, 30 min) pretreatment before TRAIL treatment (200 ng/ml, 2 h or 4 h) in DU-145 cells. Upper panel: Western blot analysis. Lower panel: The ratio of the uncleaved caspase-8 or Mst1 to corresponding actin at 0 h was set equal to 1 (not shown), and the ratio of the cleaved caspase-8 or cleaved Mst1 to corresponding actin at 2 h and 4 h of TRAIL treatment was compared to this. Data are expressed as mean ± SE of the densitometry data from three independent experiments. (E, F) Shift of cleaved forms of Mst1 during TRAIL treatment (200 ng/ml, 0–4 h) was examined in by Western blot analysis in DU-145 cells or MCF-7 cells, respectively. Lower panel: The ratio of the 40 kDa cleaved Mst1 to corresponding actin at 2 h was set equal to 1, and the ratio of the 40 kDa cleaved Mst1 to corresponding actin at 3 h and 4 h was compared to this, then again the 40 kDa cleaved Mst1 at 2 h was set equal to 1, and compared with 36 kDa cleaved Mst1 for hours 2, 3 and 4. Data are expressed as mean ± SE of the densitometry data from three independent experiments. (G) Involvement of caspase-7 with the cleaved forms of Mst1 during TRAIL treatment (200 ng/ml, 2 h) was examined in DU-145 cells after caspase-7 was downregulated by siRNA of caspase-7. Upper panel: Western blot analysis, C, control; T, TRAIL. Lower panel: The ratio of the 20 kDa cleaved caspase-7 (or 40 kDa cleaved Mst1) in TRAIL-treated si scrambled RNA-transfected cells to 35 kDa uncleaved caspase-7 (or 59 kDa uncleaved Mst1) in TRAIL-treated si scrambled RNA-transfected cells was compared to the ratio of the 20 kDa cleaved caspase-7 (or 40 kDa cleaved Mst1) in TRAIL-treated si caspase-7 RNA-transfected cells to 35 kDa uncleaved caspase-7 (or 59 kDa uncleaved Mst1) in TRAIL-treated si caspase-7 RNA-transfected cells. Data are expressed as mean ± SE of the densitometry data from three independent experiments.