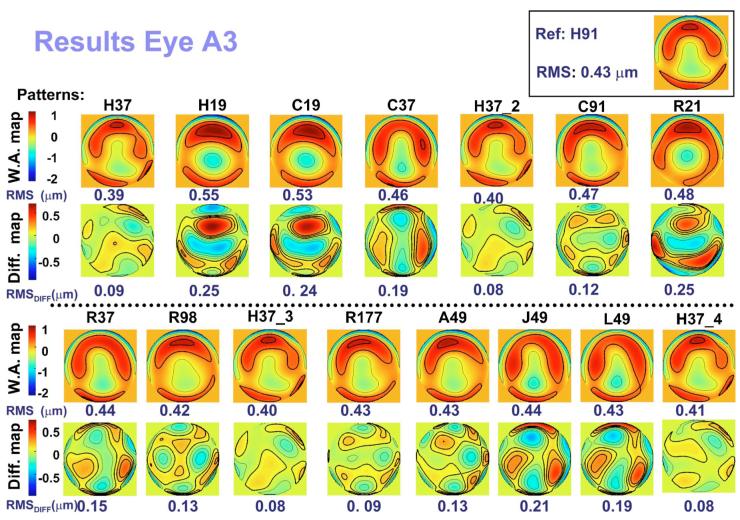
Fig. 2.
(Color online) Wave aberration maps for third and higher Zernike orders and corresponding difference maps (after subtracting the reference) obtained using the different sampling patterns for artificial eye A3. Contour lines are plotted every 0.5 and 0.1 μm for the wave aberration maps and the difference maps, respectively. Thicker contour lines indicate positive values. The RMSs for wave aberration and difference maps are indicated below each map. Each pattern is labeled according to the nomenclature described in Fig. 1. The number after H37_ indicates four different repetitions throughout the measurement. The wave aberration map corresponding to the reference (H91) is plotted in the top right-hand corner, with its corresponding RMS to the left of the map.

